

Click HERE or on Chart for Larger image
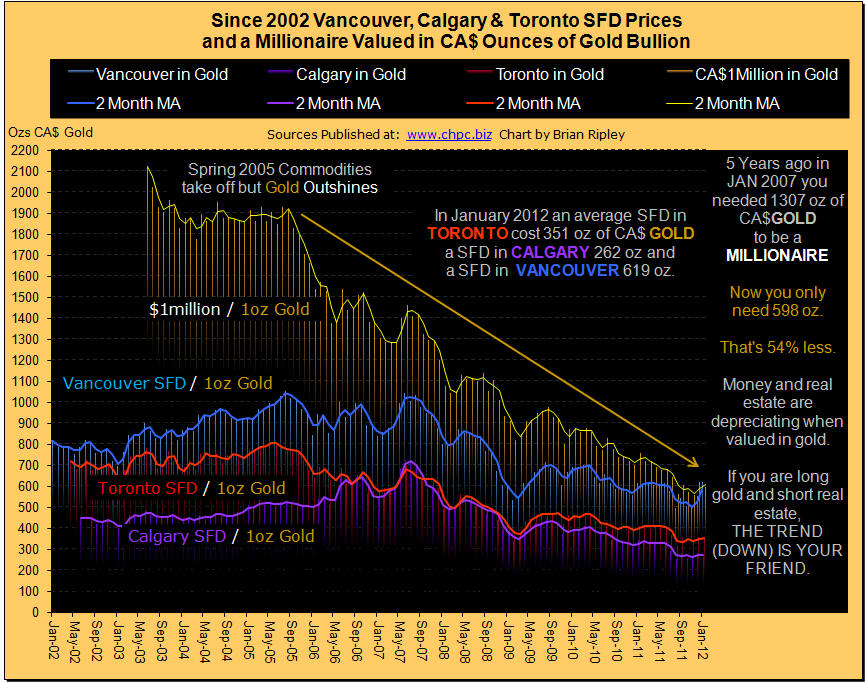
The chart above shows Vancouver, Calgary and Toronto detached housing priced in ounces of gold valued in CA$. Gold mining share prices rise as the “real price” of gold rises eg: the Gold/Commodities Ratio because the commodity cost (fuel, materials, equipment) is falling against the nominal price. See the Homestake Mining Chart from 1924 to 1935. Bullion attracts investment when credit markets contract because of its classic use as a hedge against currency depreciation and its ability to act as money. The millionaire metric allows you to see what your dollar is worth and the (declining) amount of gold you need to be a millionaire. In January 2012 the spot price of gold bounced back up causing the millionaire metric to tick back down towards trend but the sudden January data spike in Vancouver SFD prices has now priced an average house beyond that of a millionaire. Despite the Vancouver outlier, it requires 54% less gold to be a millionaire now than it did 5 years ago. See also the GOLD/CRB ratio here.
…more charts at http://www.chpc.biz/charts.html


