

In August 2016 Canada’s big city metro SFD prices hit resistance M/M except in Montreal where a new peak price came in. Toronto absorption rates are at the highs with months of inventory at 1; a new benchmark in mania. Anyone owning a house in the scorching hot Vancouver and Toronto markets is sitting on an unredeemed lottery ticket… if buyers still exist and apparently they do.
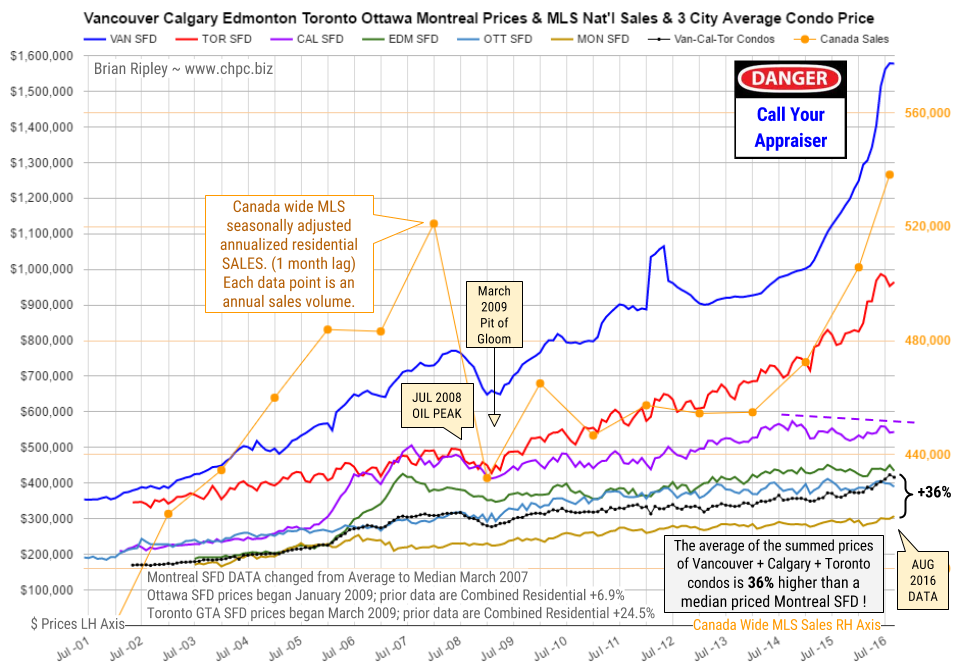
The chart above shows the average detached housing prices for Vancouver*, Calgary, Edmonton, Toronto*, Ottawa* and Montréal* (the six Canadian cities with over a million people) as well as the average of the sum of Vancouver, Calgary and Toronto condo (apartment) prices on the left axis. On the right axis is the seasonally adjusted annualized rate (SAAR) of MLS® Residential Sales across Canada (one month lag).
High net worth trophy hunters have spent the last few years picking off well located SFD properties in hot markets while the hoi polloi settled for anything before being “priced out“. Are they going to enjoy being “priced in“?
CMHC is not so sure. In November 2015 CMHC had a private audience in New York City and brought along a stress test of $35/bbl oil and its potential effect on Canada. I covered the bullet points here. Scenario 2 “if global deflation” is worth consideration for anyone heavily leveraged. The search for cash flow could be a buzzkill in 2016. When earnings drop so do asset prices.
….related:
Ozzie Jurock on the declines in Alberta’s top markets. He likes them, but Calgary and Edmonton? Not yet.


