

“Basically, price fluctuations have only one significant meaning for the true investor. They provide him with an opportunity to buy wisely when prices fall sharply and to sell wisely when they advance a great deal. At other times he will do better if he forgets about the stock market and pays attention to his dividend returns and to the operating results of his companies.” -Benjamin Graham
Let us just preface this article by stating it is typically very difficult, if not impossible, to properly time the market. We do think, however, that it is possible to lower risks (raising cash) at times when earnings multiples seem elevated to historical averages. We are currently seeing multiple indicators giving warning signs to the astute investor. Since late 2008, we have been fully invested and have ridden up with most of the bull market with very few errors of commission (except Knight Capital), but mainly errors of omission. We think at this point in the market cycle it is time to become more defensive and raise cash levels and/or rotate into lower duration fixed income investments.
Margin debt at all time high.
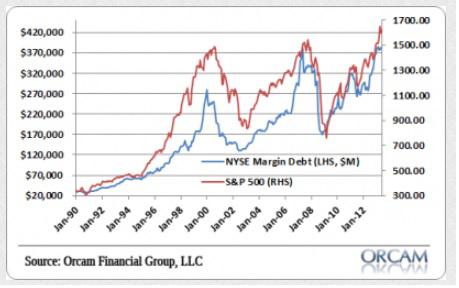
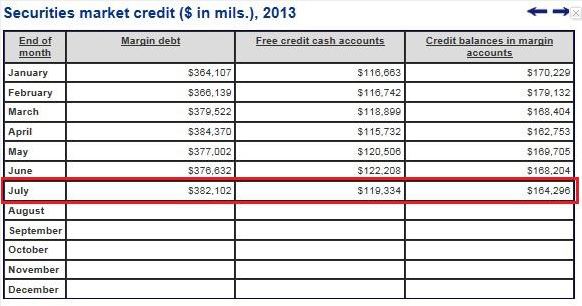
Though the NYSE has not yet published the August margin data, we can surmise that August will inevitably be higher than July, due to the pattern of markets continuing to find new highs at the beginning of the month. At current levels, we are in new territory with respect to leverage; in our opinion, most of this excess leverage is due to the easy money policies from the fed. It will be quite interesting to see how the markets react when rates get into the 3.0%+ range; we think there is a higher likelihood now for a substantial correction in equity prices of 15-20%. While there is definitely money on the sidelines, we think investors are still justifiably skeptical as a result of the financial crisis of 08′ and 09′. Given the metrics above we feel the next selloff is likely to trigger forced margin selling which could propel stocks sharply lower.
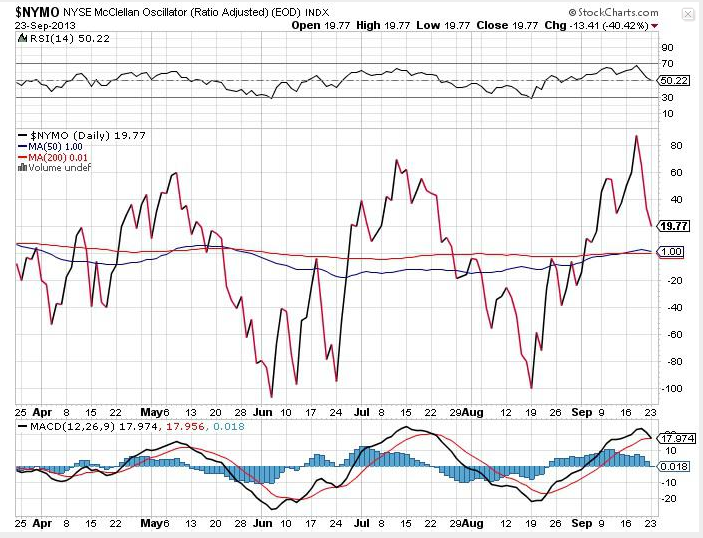
The McClellan oscillator is a market breadth indicator used to evaluate the rate of money entering or leaving the market, and is indicative of overbought and oversold conditions of the market. A recent six month high on the NYSE McClellan Oscillator also may confirm our suspicion that markets have come a little too far, too fast.
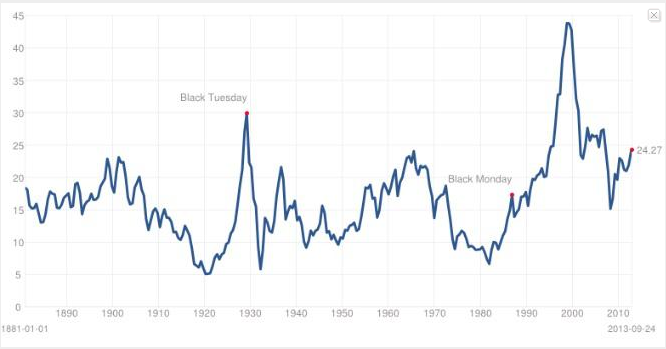
The cyclically adjusted P/E ratio is based on the average inflation-adjusted earnings from the prior 10 years. The Shiller cyclically adjusted P/E ratio shows an alarmingly high multiple of 24.27, which is at the high end of the 130 year plus timeframe.
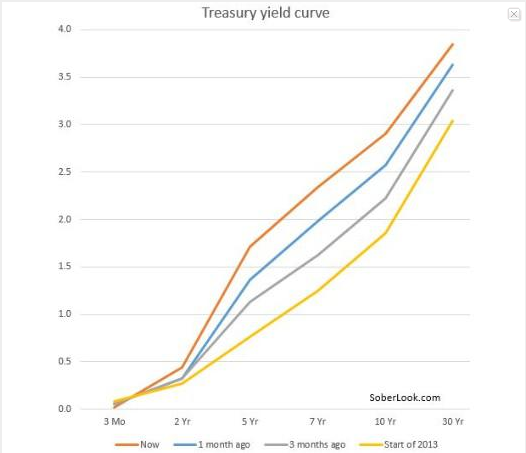
Upward sloping yield curve
While we think the markets are overbought at these levels, the Treasury yield curve is still sharply positive. Therefore, we find it very difficult to be constructively negative long-term with a steep upward sloping yield curve. An inverted yield curve is usually an excellent leading indicator that stocks will enter a bear market within 6-12 months. Yield curve inversions have preceded each of the last seven recessions in the U.S., and we believe that yield curves inversions continue to be one of the most important recessionary indicators.
Though Warren Buffet has put away his elephant gun, we think it is notable that the size of his cash hoard is almost $50 billion. If Buffet is not buying anything in this market, that to us is the equivalent of a sell recommendation. Mr. Buffet hardly ever gives market timing advice, but he has, on numerous occasions, been very close to selling at market tops and buying close to market bottoms. Another notable investor, Seth Klarman, has also been giving investors cash back. Klarman says it is, “to better match our assets under management with the opportunity set we see for new investments”. We think this is yet another sign that Klarman is having a hard time putting his money to work. While these indicators may just be clues, we feel investors at the very least should avoid putting new money to work at today’s market prices.
Our current strategy has been trimming some of our longs like Exco Resources Inc. (XCO) and adding to shorts on large up days like Sandstorm Gold (SAND) and SPDR Gold Trust (GLD). Finally, we also suggest selling short-term out of the money calls on the SPDR S&P 500 (SPY).
Disclaimer: This report is intended for informational purposes only and you, the reader, should not make any financial, investment, or trading decisions based upon the author’s commentary. Although the information set forth above has been obtained or derived from sources believed to be reliable, the author does not make any representation or warranty, express or implied, as to the information’s accuracy or completeness, nor does the author recommend that the above information serve as the basis of any investment decision. Before investing in a security, readers should carefully consider their financial positions and risk tolerances to determine if such a stock selection is appropriate.
At any time, the author of this report may trade in or out of any securities that are mentioned in the report as long or short positions in his own personal portfolio or in client portfolios that he manages without disclosing this information. At the time this report was published, the author had a long position in XCO, and a short position in SAND and GLD; either in his personal account or in accounts that he managed for others.
THIS REPORT IS NOT A RECOMMENDATION TO BUY OR SELL ANY SECURITIES MENTIONED. THE AUTHOR ACCEPTS NO LIABILITY FOR HOW READERS MAY CHOOSE TO UTILIZE THE INFORMATION PRESENTED ABOVE.
Additional disclosure: We are short SAND and GLD, and will potentially enter into a transaction in the SPY within the next 72 hours.


