

Despite fears a Trade War would dull the Dollars appeal, the dollar Index jumped again this morning. espite consistent headlines declaring the US dollar will fall because of the US China trade war. As you can see from the chart below, while the US dollar did fall though long before trade war worries became persistant, versus a basket of currencies in fact it has moved up over 1 percent since the end of January. The USD/CAD currency is also covered below – R. Zurrer for Money Talks
Note: Double click all charts for larger images
In yesterday’s Forex Trading Alert at 9:31am, we took a closer look at the current situation in the USD Index:
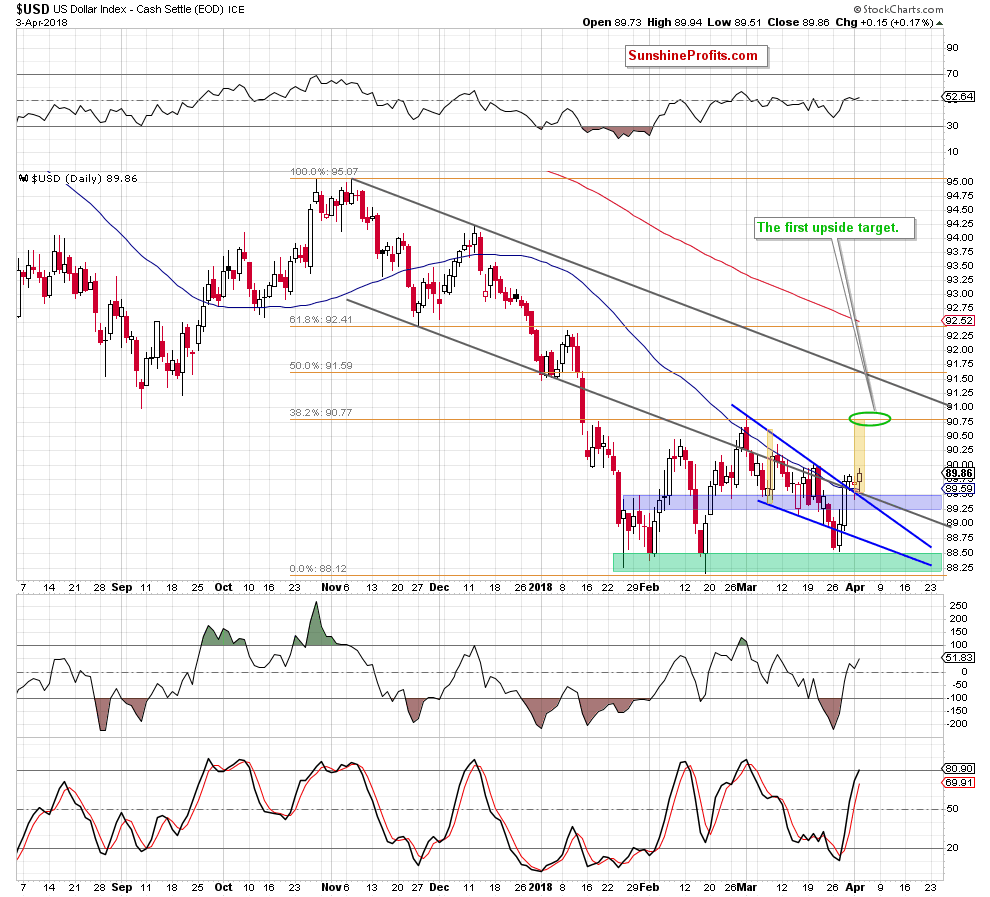
From the short-term point of view, we see that the greenback came back above two important resistance lines – the previously-broken lower border of the black declining trend channel and the upper line of he blue declining wedge.
Yesterday, the index verified this breakout, which together with the buy signals generated by the indicators suggest further improvement.
How high could the U.S. dollar go in the coming day(s)?
In our opinion, the first upside target will be around 90.77, where the 38.2% (Ed Note: at 6:24am PST April 5th the US dollar is up +0.24 at 90.36) Fibonacci retracement and the March peak are. Additionally, in this area the size of the upward move will correspond to the height of the rising wedge (we marked it with the green ellipse), which increases the probability of the pro-bullish scenario in near future.
If this is the case and the index climbs to our first upside target, we’ll also see a realization of the bearish scenario in the case of EUR/USD as the exchange rate will test the March low and our downside target at 1.2173.
USD/CAD Rewards Bears
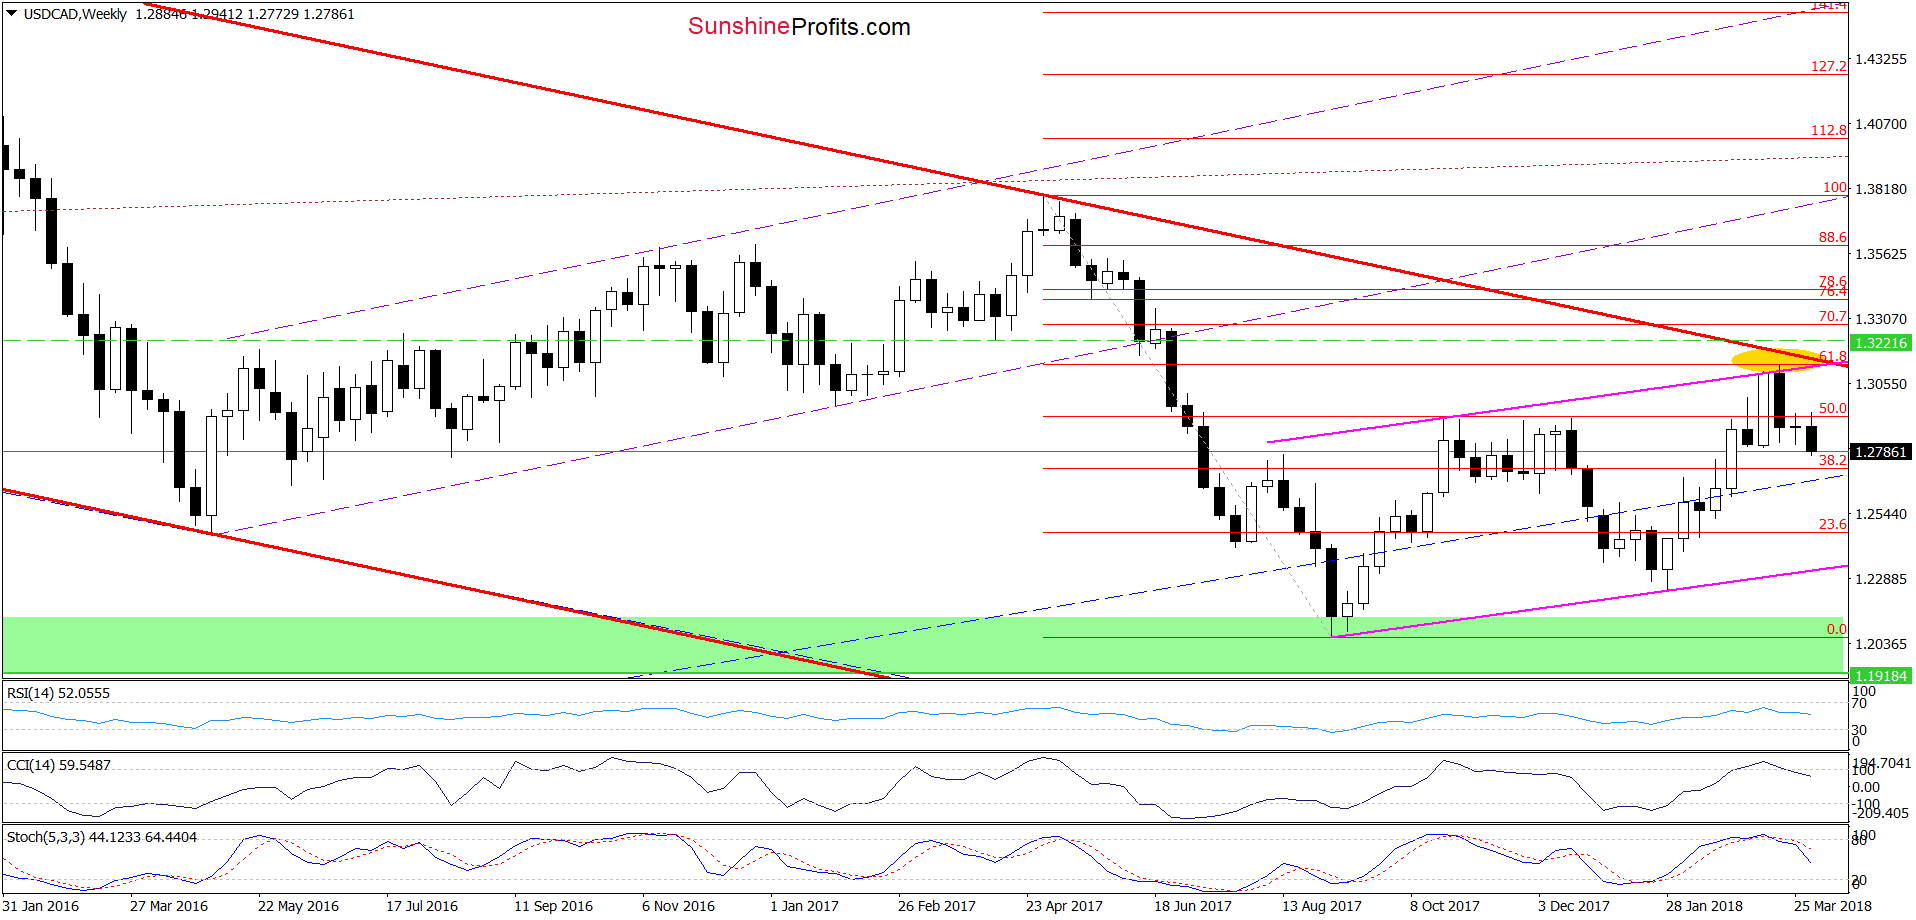
Looking at the medium-term chart, we see that although USD/CAD moved a bit higher earlier this week, currency bears took control quite quickly, which resulted in another move to the downside. Additionally, the sell signals generated by the weekly indicators remain in the cards, supporting currency bears and lower values of the exchange rate.
Are there any short-term factors that could thwart these plans?
Before we answer to this question, let’s recall the quote from our last commentary on this currency pair:
(…) although USD/CAD bounced off the blue support zone, the pair is still trading in the green consolidation around the yellow resistance zone and well below the previously-broken lower border of the green rising trend channel.
What does it mean for the exchange rate? In our opinion, as long as the pair remains under the upper border of the formation, another attempt to move lower is very likely.
If this is the case and USD/CAD extends losses from here, we’ll see (at least) a re-test of the blue support zone in the coming days, which will make our short positions even more profitable (as a reminder, we opened them on March 19, when USD/CAD was trading at around 1.3116).
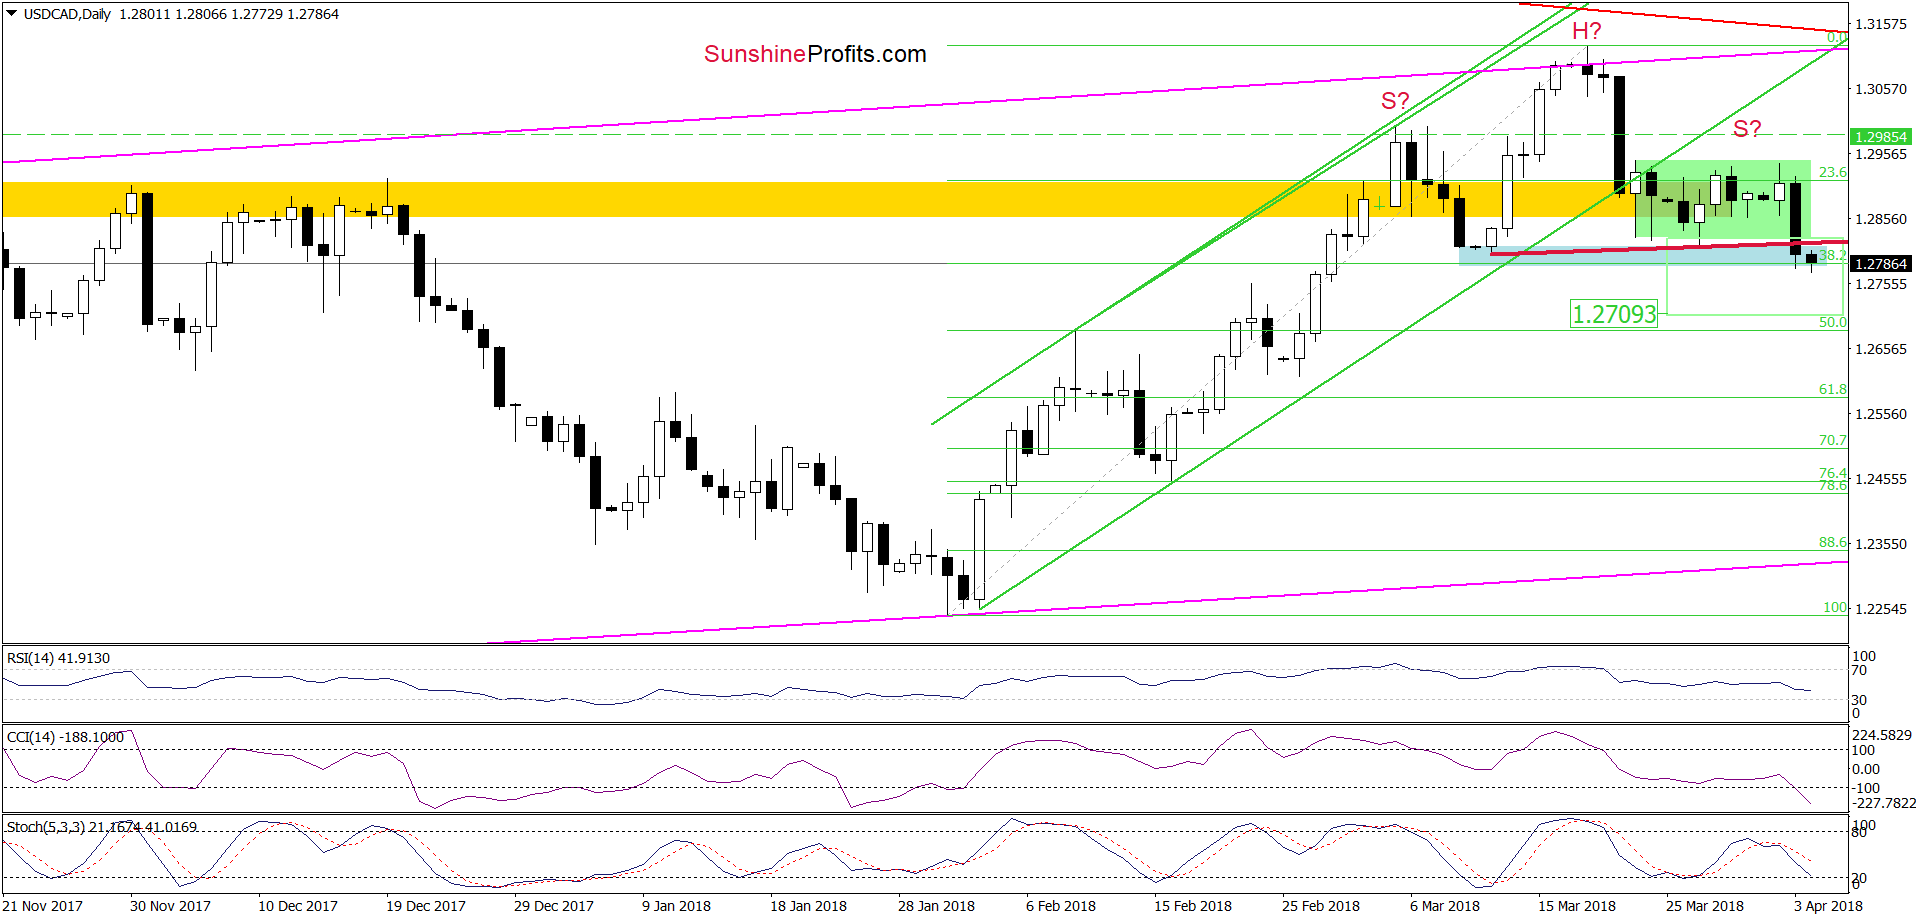
As you see on the daily chart, the situation developed in tune with our assumptions and USD/CAD declined sharply after unsuccessful attempt to break above the upper border of the green consolidation. Thanks to yesterday’s downswing, the pair dropped under the lower line of this formation and reached our next downside target – the blue support zone and the 38.2% Fibonacci retracement.
Although this support area could trigger a rebound, the sell signals generated by the indicators remain in the cards, which together with yesterday’s breakdown suggest further deterioration and a drop to around 1.2709, where the size of the move will correspond to the height of the green consolidation.
And speaking about the bearish potential… Looking at the daily chart, you probably already noticed a potential head and shoulders formation. You’re right, the right arm of the pattern doesn’t look perfectly like in technical analysis books, but yesterday’s downswing took the exchange rate under the neck line of the formation, increasing the probability of a bigger move to the downside. Nevertheless, in our opinion, such price action will be more likely and reliable if USD/CAD falls below the blue support zone. In this case, the likelihood of a decline under the above-mentioned downside target will increase significantly.
So, how low could the exchange rate go if the situation develops in line with the pro-bearish scenario?
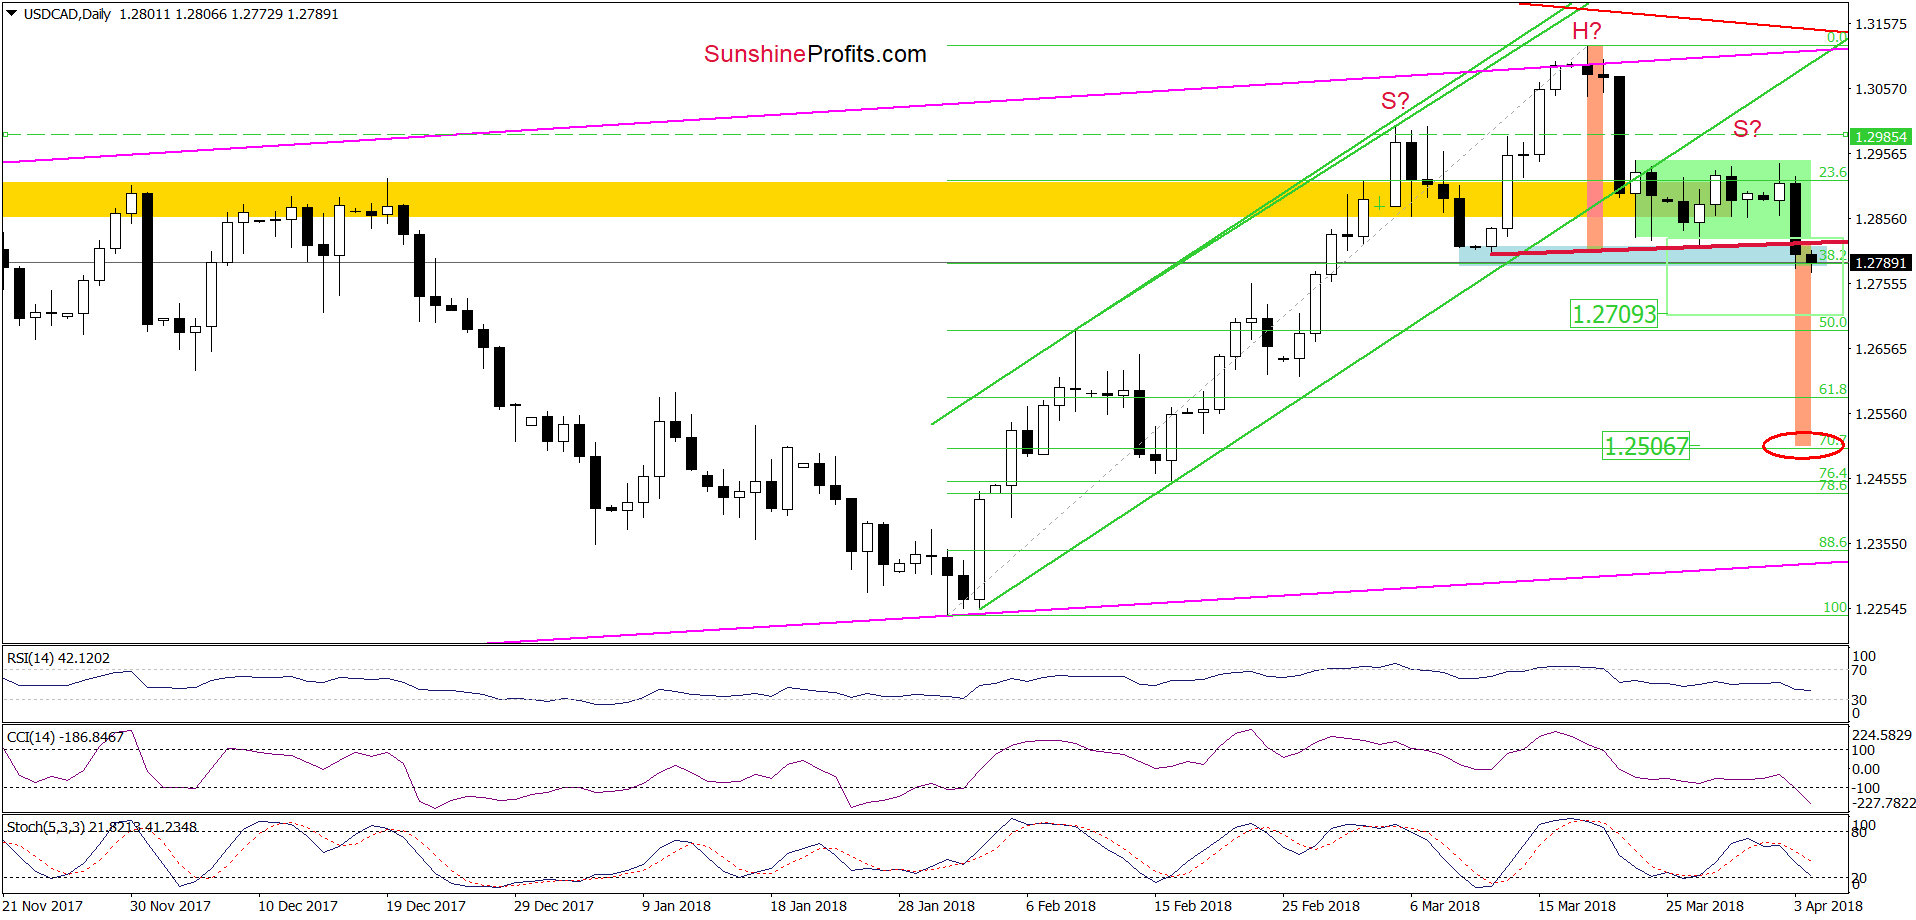
In our opinion, the next downside target will be around 1. 2506, where the size of the downward move will correspond to the height of the head and shoulders formation. Nevertheless, before we see the pair at this level, currency bears will have to break under 50% and 61.8% Fibonacci retracements first. Therefore, we will continue to monitor the market and keep our subscribers informed should we see a confirmation/invalidation of the above.


