

How EWI’s Energy Specialty Service used objective analysis to anticipate the May turnaround in crude oil
One of the biggest flaws of mainstream financial analysis is that it baits traders with a specific fundamental “hook.” And once snared, they are forced to go wherever the reel draws them in, powerless to resist.
If prices should go the other way (as they often do) the trader is caught while the experts get off scot-free with choice phrasing like “prices fall DESPITE bullish supply data,” OR “prices BRUSH OFF bearish jobs report.”
The Wave Principle, on the other hand, is founded on a number of key rules and guidelines that enable you to adjust your Elliott wave counts as price action sees fit. With this solid framework in place, Elliott wave analysts approach a market able to determine these (and more) criteria:
- Fibonacci-calculated price support and resistance levels on a chart
- The likely length of developing waves in relation to other waves
- And, whether the trend at hand is impulsive or corrective– as in, here to stay or not.
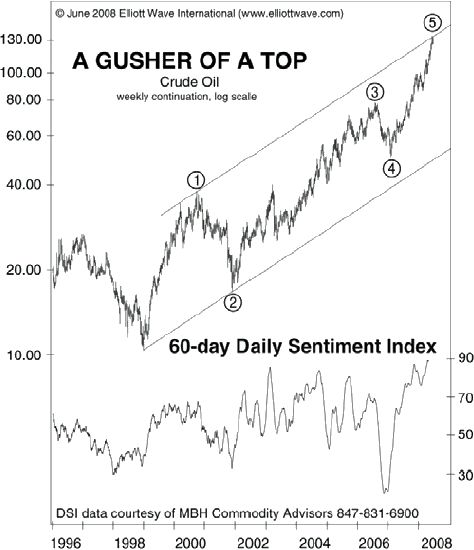
Below here is the top of the Completed Elliottwave Move in the Oil Bull Move at the top in 2008
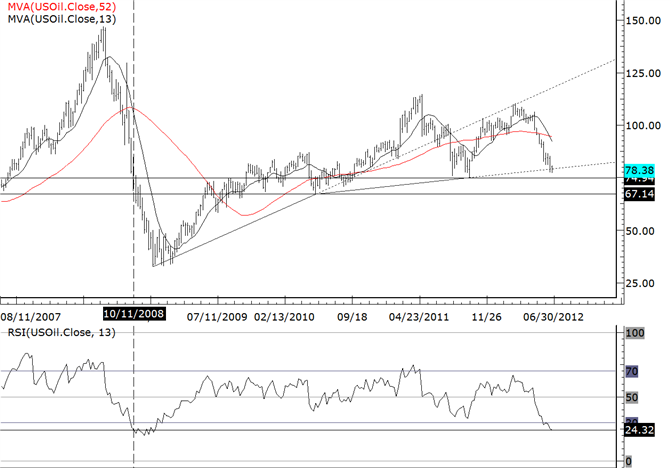
Here is how it has unfolded since the top as seen on this Monthly Oil Chart which is fairly clear to see that it is in a corrective mode since the top in 2008

Let’s turn to a real-world example with the recent price action in crude oil. See, on May 2, both the mainstream experts AND EWI’s Energy Specialty Service were near-term bullish on crude oil. Herein, however, lies the difference:
- The fundamental camp presents its case with this May 2 news story: “Crude oil futures start May by bouncing to a five-week high as US manufacturing growth in April hit the highest in 10 months, boosting the demand outlook for oil.”
In this case, there is no wiggle room to prepare for an alternate (i.e. bearish) outcome. This would be fine IF market analysis was about 100% certainties. But, as Elliott analysts know, it’s aboutprobabilities.
- That same day, May 2, EWI’s Energy Specialty Service revealed how its “preferred” bullish Elliott wave count for crude oil hinged on this crucial action: “Crude needs to continue higher to support the idea that the next leg of the advance is underway. At this point, trade below 101.82 won’t bode well for the idea that the decline from the early March peak is done… and an even longer decline would seem likely.”
On May 3, crude oil prices broke the 101.82 price level. The May 3 Energy Specialty Service1:56 pm intraday update confirmed the bearish event and wrote:
“The market’s failure to extend the advance argues for the alternate count… A much deeper decline should lie ahead.”
And again, the May 15 Energy Specialty Service “DAILY” update suggested the bearish trend would not be a temporary and wrote:
“Regardless of the short-term iterations, the key point is that sharply lower lows should be the central theme for some time to come.”
It has been “some time” indeed since then. Don’t get caught in a fundamental corner. Stay ahead of the near-term changes in crude oil via EWI’s trader-focused Energy Specialty Service.


