

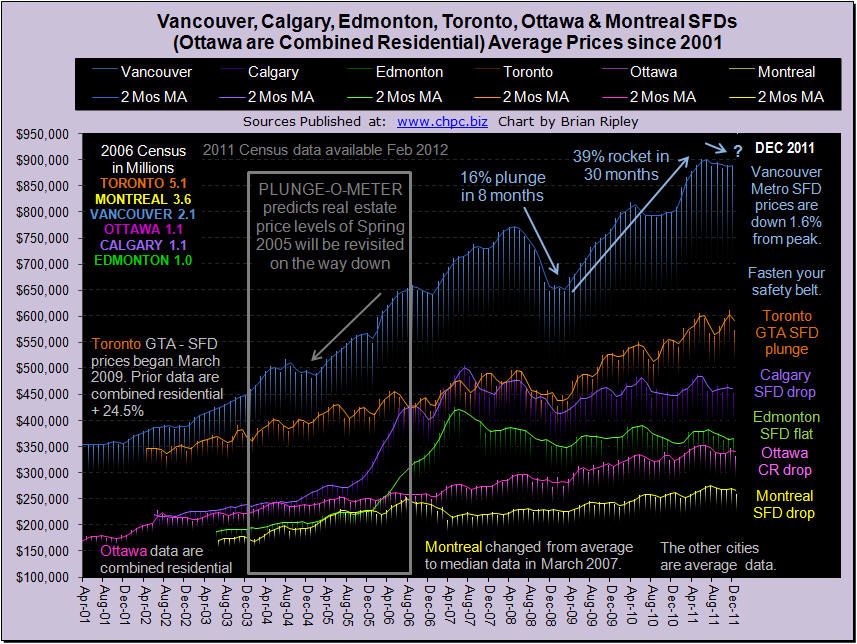
The chart above shows the detached housing prices for Vancouver, Calgary, Edmonton, Toronto, Ottawa* and Montréal (*Ottawa are combined residential). In December 2011 Canadian real estate prices resumed the trend down (Click HERE or on the image for Larger Chart) especially in Toronto, Ottawa and Calgary with M/M drops of 6%, 4.4% and 3.6%. Year end sales dropped off (Scorecard) and we will have to wait for January-February figures to get a glimpse of buyer appetite which certainly is not being held back by the cost of money (Yield Chart). Borrowing costs are low and asset prices are high. Should you be a buyer or a seller… start with figuring out your ROI here.


