

CLICK CHART TO ENLARGE
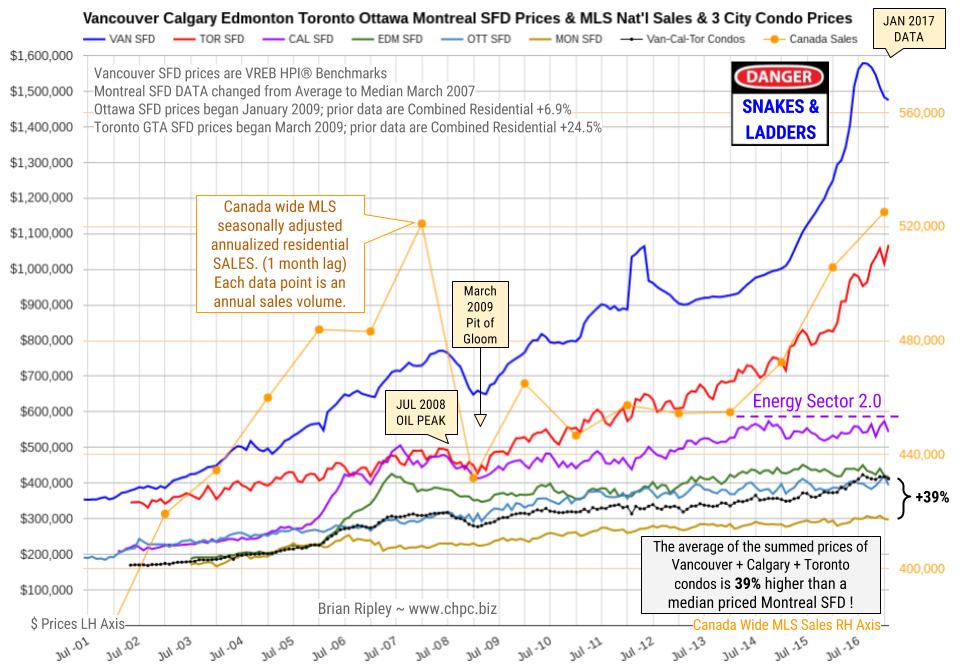
The chart above shows the average detached housing prices for Vancouver*, Calgary, Edmonton, Toronto*, Ottawa* and Montréal* (the six Canadian cities with over a million people each) as well as the average of the sum of Vancouver, Calgary and Toronto condo (apartment) prices on the left axis. On the right axis is the seasonally adjusted annualized rate (SAAR) of MLS® Residential Sales across Canada (one month lag).
In January 2017 Canada’s big city metro SFD prices coiled about or slid off their near term highs except in Toronto where detached houses and town houses fetched new peak prices. Anyone owning a house in the scorching hot Toronto market is sitting on an unredeemed lottery ticket. In Vancouver scorched earth ruins are beginning to appear. Notice Calgary prices are labouring under the new Energy Sector 2.0 which could be anticipating the Trumpster’s U.S. energy independence.
….related: The Canadian Real Estate Plunge-O-Meter (The Plunge-O-Meter tracks the dollar and percentage losses from the peak and projects when prices might find support.)


