

The Plunge-O-Meter tracks the dollar and percentage losses from the peak and projects when prices might find support. On the price chart in the spring of 2005 there was a 4-6 month plateau period while buyers and sellers twitched like a herd. When the credit spreads narrowed and the yield curve began its journey towards inversion, the commodity stampede began.
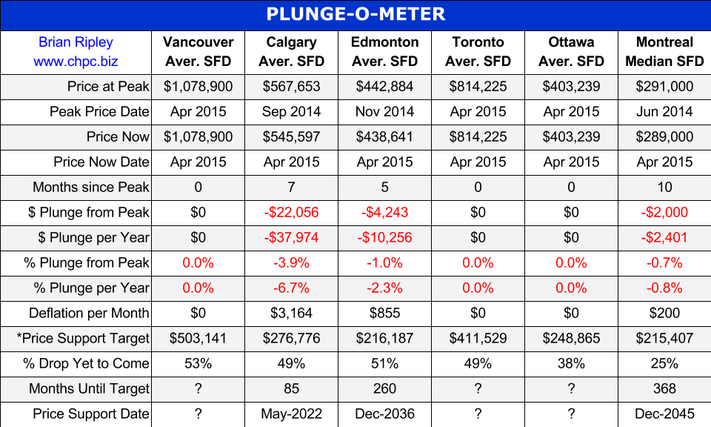
The Price Support target represents prices at March 2005; the start of a 40 month period of ardent speculation in all commodities; then a full blown crash into the pit of gloom (March 2009); and then another 39 month rocket ship to the moon but then the crowd suddenly thinned out in April 2012. The revival of spirits erupted in 2013 as global money went short cash and long real estate on an inflation bet (see Whale Watching). Now we have a major divergence with Vancouver and Toronto going against the trend.
…see the price trends of 6 Canadian Cities with more than a milion HERE


