

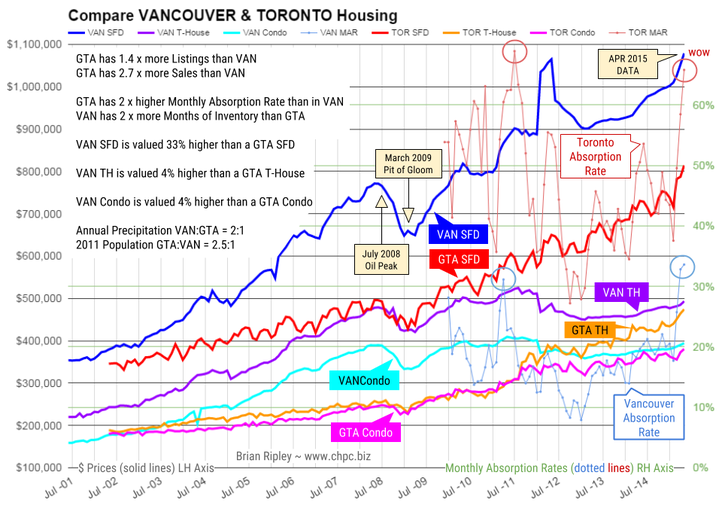
The chart above shows the average Single Family Dwelling, Townhouse and Condo prices (solid plot lines) of both Vancouver and Toronto as well as the Monthly Absorption Rate (MAR = Sales/Listings as dotted plot lines). At the Vancouver peak in April 2012, Vancouver metro SFDs were an astounding 64% (1.6 times) more expensive than GTA comparables. But Toronto has been on a tear out of the March 2009 Pit of Gloom and the SFD price differential has shrunk to 33% (1.3x) even with the current (April 2015) peak average SFD price in Vancouver.
…..for larger chart & to read more go HERE


