
 Rising sentiment toward stocks took a big U-turn recently, falling to negative levels not seen since March 2009. That’s a signal to Savita Subramanian, equity and quant strategist at Bank of America Merrill Lynch, that there are still opportunities left for bulls.
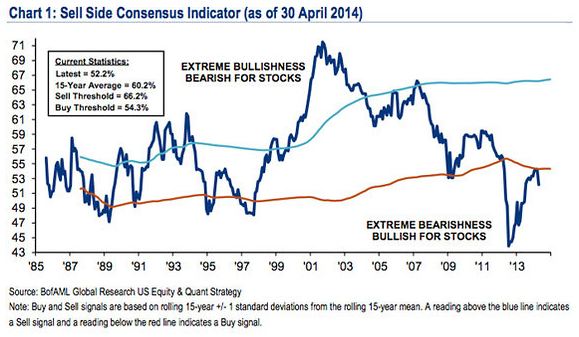
Subramanian noted that B. of A. Merrill Lynch’s Sell Side Indicator, which has been on the rise lately, took a sharp downturn recently to 52.2 from 54.1. The contrarian indicator denotes the average stock-allocation weighting from strategists. The lower the indicator, the more likely stocks will have a positive return.
Subramanian writes:
Given the contrarian nature of this indicator, we remain encouraged by Wall Street’s ongoing lack of optimism and the fact that strategists are still recommending that investors significantly underweight equities, at 52% vs. a traditional long-term average benchmark weighting of 60-65%. Even though the S&P 500 has risen by over 35% since sentiment bottomed in 2012, history suggests that strong equity returns can last for years after the indicator troughs.
In the meantime, stocks are clawing their way back from a rough 2014. On Wednesday, the Dow Jones Industrial Average DJIA reached its first record high close of the year, topping a Dec. 31 high, while on Thursday, the S&P 500 IndexSPX traded within 0.3% of its closing high set on April 2.
In the past, the strategist notes, the indicator has had a pretty good track record with the next 12 months logging gains 97% of the time when the indicator has been this low or lower, with a median 12-month return of 27%.


