
WEEKLY COMMENTARY
Stick With Your Winners
Picking the right stocks to own is what most people focus in on but the entry is actually not the most important component of the trade. Without good risk management and a sound exit strategy, even the best stock pickers will fail.
I manage risk by limiting the size of the losses I take. If a stock that I buy breaks down through support, I sell it and take the small loss. I recognize that I am not going to be right all of the time and trading success requires that I take small, manageable losses when I am wrong.
Judging the success of a trade should be in consideration of the risk taken. If you risk $1000 to make $500, you have earned a reward for risk ratio of 0.5. If you make $5000 by risking $1000 then you have earned a reward for risk of 5. Obviously the latter is better but many traders never realize big gains because they sell their winners early. This is motivated by a fear of a winner turning in to a loser but it can really hurt performance if you don’t let your profits run.
Normal people will actually do the opposite of what they should by being patient with their losers. It is painful to take a loss so any normal, pain avoiding person will avoid taking that small loss when the market proves them wrong and instead hold on, hoping for the stock to turn around. The small loss often grows to be a big one.
Let’s review the stocks featured in this newsletter two weeks ago and go through the concept of reward for risk and what these stocks have done since their feature on Feb 10 2014. Here are the original comments:
T.BLD
T.BLD is breaking from a pull back after a strong run higher to start 2014. This is a good continuation pattern which should allow the stock to move up to new 52 week highs in the near term. Support at $2.20.
T.KGI
T.KGI is one of many gold mining stocks that are showing good signs of a turnaround after a lengthy bear market. The stock is breaking higher from a rising bottom and appears to be reversing the downward trend. Support at $3.20.
T.AUQ
T.AUQ is breaking the two year downward trend on the long term chart and through resistance from a cup and handle pattern on the daily chart. Support at $4.95.
Notice in my features I mention support; that is the loss limit point. So, T.BLD was at $2.47 when I featured it with support at $2.20. That means the risk was $0.27 a share. As I write this the stock is at $3.30 which is up $1.10 and a reward for risk of 4.07.
T.KGI was featured at $3.74 with a support at $3.20 so risk is $0.54. Today the stock is at $4.02, up a reward for risk of 0.52.
Finally, T.AUQ was featured at $5.47 with support at $4.95. Today it is at $5.65 with a reward for risk of 0.35.
So, of these three stocks, all three are winners but only one is a strong winner with a reward for risk of 4.07. If you risked $500 on each trade, you would up a total of $2470.00 but most of that profit comes from the strongest stock, T.BLD.
T.BLD showed some minor weakness on Feb 20th, not enough to give an exit signal but enough to make a nervous shareholder look for the exit door. What if the trader lacks patience and jumps out because of one down day? They leave a lot of money on the table!
The point of these examples are to show the importance of letting your winners run. As traders, we are playing a numbers game. Out of 10 trades, some will be small winners, some will be small losers and perhaps two will be big winners. It is the big winners that give us market beating profits but if you don’t have the patience to stick with them, you really hurt overall performance.
STRATEGY OF THE WEEK
I am constantly doing Market Scans on Stockscores, looking for stocks showing abnormal market activity, the signal that investors have become excited about a company’s prospects and are likely to send the stock higher. Abnormal activity out of predictive chart patterns can be applied on an intraday chart for day traders, a daily chart for swing traders or a weekly chart for position traders. This week, I highlight a couple of Canadian stocks that I have featured recently to readers of my daily newsletter (www.tradescores.com) which are showing good long term weekly charts.
STOCKS THAT MEET THE FEATURED STRATEGY
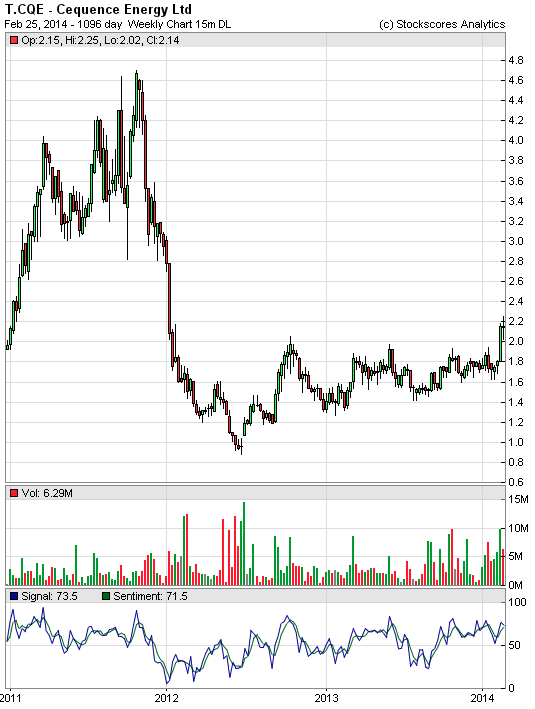
1. T.CQE
T.CQE broke out last week and has pulled back a little bit to start this week. The long term outlook is excellent for the stock as it has broken from a lengthy ascending triangle pattern on the 3 year weekly chart. Support at $1.68.

2. T.T
T.T broke out of a cup and handle pattern and up to new highs a couple of weeks ago. After a short pull back, the buyers have come back to the stock again and look to be willing to continue its upward trend. Support at $35.95.

 Stockscores Market Minutes Video
Having a solid process for finding trades is only effective if you also have the patience and discipline to carry out the plan effectively. This week’s Market Minutes video demonstrates the use of the Market Scan for one strategy and then provides the regular weekly market analysis.View the video by clicking here.
References
- Get the Stockscore on any of over 20,000 North American stocks.
- Background on the theories used by Stockscores.
- Strategies that can help you find new opportunities.
- Scan the market using extensive filter criteria.
- Build a portfolio of stocks and view a slide show of their charts.
- See which sectors are leading the market, and their components.
Disclaimer
This is not an investment advisory, and should not be used to make investment decisions. Information in Stockscores Perspectives is often opinionated and should be considered for information purposes only. No stock exchange anywhere has approved or disapproved of the information contained herein. There is no express or implied solicitation to buy or sell securities. The writers and editors of Perspectives may have positions in the stocks discussed above and may trade in the stocks mentioned. Don’t consider buying or selling any stock without conducting your own due diligence.


