
Short term weakness provided a trader’s buying opportunity last week. Preferred strategy is be selective with a focus on sectors that have a history of outperformance at this time of year.
Equity Trends
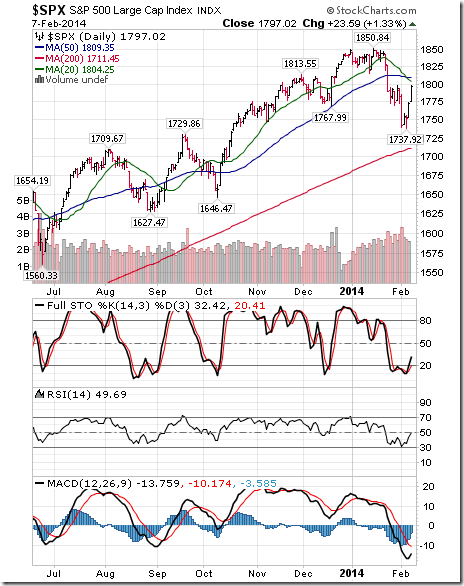
The S&P 500 Index added 14.43 points (0.81%) last week. Trend changed from neutral to negative on a move below 1,767.99. The Index remains below its 20 and 50 day moving averages. Short term momentum indicators are oversold and showing signs of recovery.

Percent of S&P 500 stocks trading above their 50 day moving average rose last week to 44.60% from 40.00% after bottoming at 25.20%.

Percent of S&P 500 stocks trading above their 200 day moving average increased last week to 74.40% from 71.80% after bottoming at 61.60%.
Bullish Percent Index for S&P 500 stocks fell last week to 63.60% from 69.00% and remained below its 15 day moving average. The Index remains in an intermediate downtrend.
Bullish Percent Index for TSX Composite stocks was unchanged last week at 70.71% and remained below its 15 day moving average. The Index remains intermediate overbought.

The TSX Composite Index added 91.56 points (0.67%) last week. Trend remains up (Score: 1.0). The Index moved above its 20 day moving average on Friday (Score: 1.0). The Index continues to outperform the S&P 500 Index (Score: 1.0). Technical score based on the above indicators is 3.0 out of 3.0. Short term momentum indicators are neutral.
Percent of TSX stocks trading above their 50 day moving average increased last week to 64.20% from 60.08%. Percent remains intermediate overbought.

Percent of TSX stocks trading above their 200 day moving average increased last week to 72.69% from 71.43%. Percent remains intermediate overbought.
….continue reading the Economic News This Week & viewing another 40 charts HERE


