
Maintain Healthy Cash.
The Bottom Line
Look for wild volatility in equity markets this week. However, the correction in North American equity markets that started on August 2nd and likely to last until the end of October continues to be a flat rather than a downtrend. Preferred strategy is to maintain a healthy cash position in preparation for possible entry into the favourable seasonal starting in late October.
Economic News This Week
Canadian July Real GDP to be released at 8:30 AM EDT on Monday is expected to increase 0.5% versus a decline of 0.5% in June.
September Chicago PMI to be released at 9:45 AM EDT on Monday is expected to increase to 54.3 from 53.0 in August.
September ISM to be released at 10:00 AM EDT on Tuesday is expected to slip to 55.2 from 55.7 in August.
August Construction Spending to be released at 10:00 AM EDT on Tuesday is expected to increase 0.4% versus a gain of 0.6% in July
September ADP Private Payrolls to be released at 8:15 AM EDT on Wednesday are expected to slip to 175,000 from 176,000 in August
Weekly Initial Jobless Claims to be released at 8:30 AM EDT on Thursday are expected to increase to 315,000 from 305,000 last week.
August Factory Orders to be released at 10.00 AM EDT on Thursday are expected to increase 0.2% versus a decline of 2.4% in July.
September ISM Services to be released at 10:00 AM EDT on Thursday are expected to slip to 57.0 from 58.6 in August.
September Non-farm Payrolls to be released at 8:30 AM EDT on Friday are expected to increase to 183,000 from 169,000 in August. September Private Non-farm Payrolls are expected to increase to 180,000 from 152,000 in August. September Unemployment Rate is expected to slip to 7.3% from 7.5% in August. September Hourly Earnings are expected to increase 0.2% versus a gain of 0.2% in August
Equity Trends
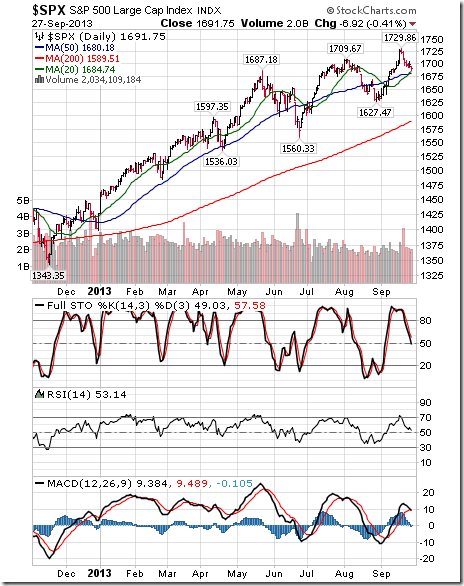
The S&P 500 Index fell 18.16 points (1.06%) last week. Trend remains up. The Index remains above its 20 and 50 day moving averages. Short term momentum indicators are trending down.

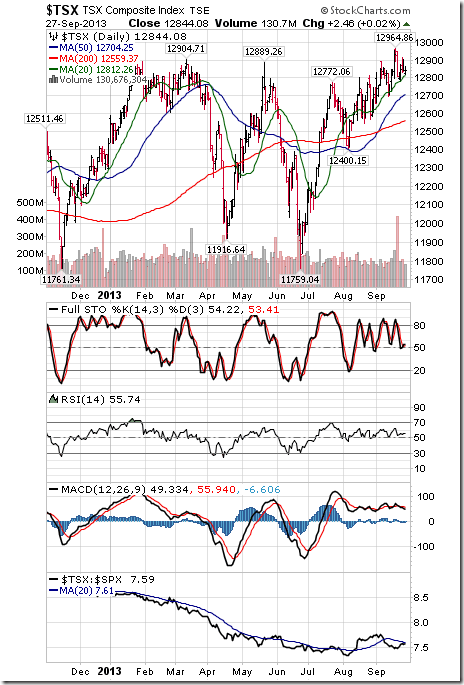
The TSX Composite Index added 37.61 points (0.03%) last week. Trend remains up (Score: 1.0). The Index remains above its 20 day moving average (Score: 1.0). Strength relative to the S&P 500 Index changed from negative to neutral (Score: 0.5). Technical score based on the above indicators improved to 2.5 from 2.0 out of 3.0. Short term momentum indicators are neutral.
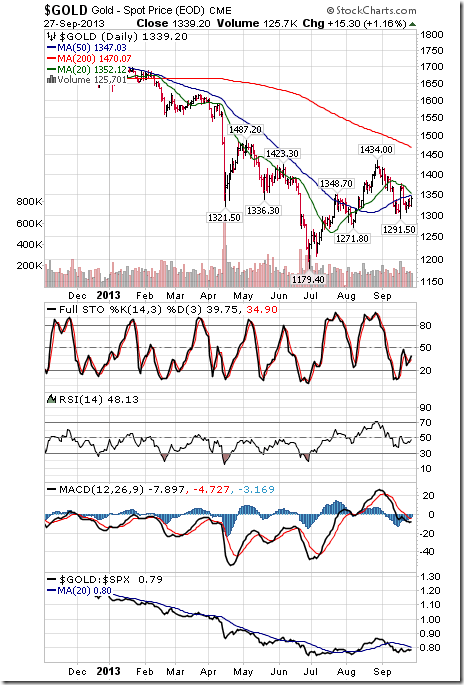
Gold added $6.70 per ounce (0.50%) last week. Trend remains up. Gold remains below its 20, 50 and 200 day moving averages. Strength relative to the S&P 500 Index remains negative. Technical score remained at 1.0 out of 3.0. Short term momentum indicators have recovered to a neutral level.
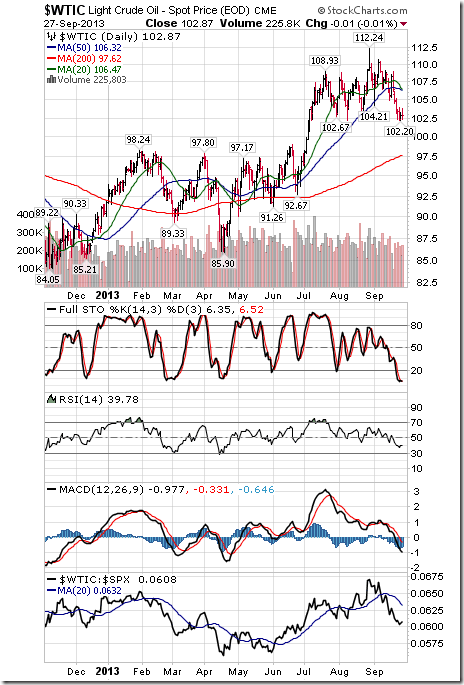
Crude oil fell $1.88 per barrel (1.79%) last week. Trend changed from up to neutral on a move below $102.22. Crude remains below it s20 and 50 day moving averages. Strength relative to the S&P 500 Index remains negative. Technical score eased to 0.5 from 1.0 out of 3.0. Short term momentum indicators are oversold.
….much more HERE including 45 more charts


