

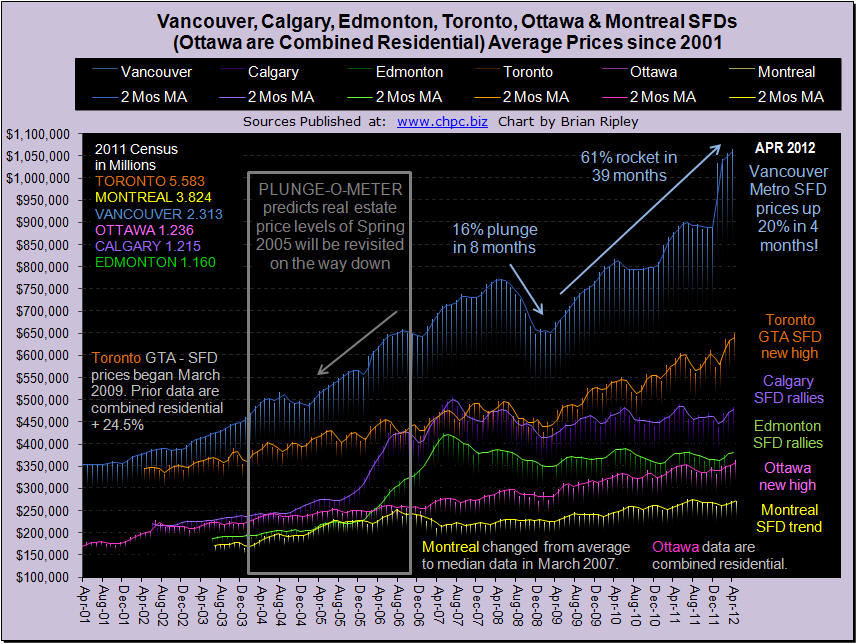
The chart above shows the detached housing prices for Vancouver, Calgary, Edmonton, Toronto, Ottawa* and Montréal (*Ottawa are combined residential). In April 2012 urban flippers continued reeling in accommodating buyers who jumped at asking prices on detached dwellings pushing them to new record highs in Vancouver, Toronto and Ottawa on energetic sales in the east but divergent negative sales in Vancouver (Scorecard). Calgary and Edmonton held and added to their gains from last month but their peak prices happened years ago in the Spring and Summer of 2007 (Plunge-O-Meter). The 10yr less the 2yr spread continues to narrow (35th month since May 2009). The last time this happened, the 10yr less the 2yr spread narrowed from Spring 2004 to Summer 2007 (similar duration as now) which set up the 2007-2009 crash. It’s an interesting comparison, buckle up.
All Data & Charts from Canadian Housing Price Charts


