


![]()
Does diversification make you safe from market swings? Watch this week’s Stockscores Market Minutes video for the answer.Click here to watch the video on Youtube.
How do you assess a stock that you are considering for purchase? There can be an infinite number of answers to that question, some methods are effective and others will lead you to random results. Here are some things to consider when doing your analysis before you purchase a stock for your portfolio.
1. Understand who is in control of the stock
The best stock purchases come when control is shifting from sellers to buyers, when a downward trend is ending and an upward trend is beginning. That is also the most difficult moment to predict. It is easier to find stocks that the buyers have control of but are not yet well in to their upward trend. To do this, look for stocks that have rising bottoms on their stock chart but are not yet well in to an upward trend. A simple guideline is that stock’s that have a Sentiment Stockscore of 60 or higher are in the control of the buyers, but we want to get these stock early in the upward trend, not well in to it.
2. Know the trend of the company’s sector
A stock’s price performance will have some correlation to the market in general and a stronger correlation to other stocks in a similar industry. If you are considering an oil stock, check out the chart and the Stockscores indicators for an oil stock index. These are available on Stockscores in the Sector Watch tool, or by knowing the symbol of the industry index or ETF.
3. Find out if there will be a supply of new stock in the future
This is a rule more for smaller capitalized stocks, but it is a good idea to find out if stock issued from a recent financing will become free trading in the near term. If a company issues new shares to raise money, the new shares will come to the market and the investors that bought that financing may sell those shares when they are allowed to. Many newly issued shares have a hold period, so it is worth doing the research to find out when past issued shares come free trading. You can do this for US stocks by going to www.edgar.com and for Canadian stocks by going to www.sedar.com, or by going to the company’s website and checking out their news releases and regulatory filings.
4. Identify price zones where sellers will act
Investors have a memory and so too does the market. The market will remember past price tops and areas of sideways price trading. If a stock is moving up in to these price zones, there is a good chance that the upward momentum will stall there. Take the time to look at a stock’s chart going back at least two years to see areas where sellers may find inspiration to unload more stock and cause a top to an upward trend.
5. Look for signs of new information
A stock’s price will not move on what has happened in the past, it will move on what happens in the future. This means that fundamental information that is announced in the future will have a great affect on the movement of stock price. Within every company, there are a small group of investors that tend to get better information than others and these people may act in the market ahead of important fundamental events, creating abnormal market activity. Looking at a stock chart for signs of abnormal activity, including abnormal volume levels, abnormal price movement or breaks out of trading ranges can be a good way to identify stocks that may have big news coming.
6. Find out the dates of potentially significant news announcements
Big price moves in stocks are event driven, so it pays to do some research to find out if there is big news coming in the future. Is a company in a legal dispute that could soon be resolved? Are they testing a new product that may soon come to market? Are they seeking new resources that could improve their ability to make money in the future? Look for any event that could soon be announced and have a major effect on the stock’s price and assess the risks of a downward move versus the potential rewards of an upward move.
7. Read the message of the market
Stock charts tell us a story about what investors feel (emotional) about a company and what they know (rational) about a company. Learn to read the chart patterns to understand if the company is doing good things and if the market likes what they are doing. The best opportunities come when the market is just beginning to learn of something that will have lasting and positive effects on the company’s ability to make money. By getting in early on these hot story stocks, investors can enjoy lasting money making trends.
8. Think about what the crowd may be thinking
The crowd tends to be late trend investors so it is best to be one step ahead of the crowd. The crowd will take their investment cues from the mass media which makes the mass media a good contrary indicator. If an investment idea is front page news or the lead story on a widely watched TV program, it is likely that you are nearing a top in the stock. Be wary of following the crowd.
9. See if there are signs of emotion in the market
Emotional decision making causes investors to misprice stocks, either to the upside or the downside. In times of panic selling, there are bargains. In times of euphoria, there are overpriced stocks. To identify emotion, look for parabolic (curving) trends and high volume. In these cases, it is better to go against the crowd as the stock is likely to move back to the linear trend line.
10. Determine whether investors are confident or uncertain
Price volatility is an indication of investor confidence in the price they have given to the stock. Think of the stock market as a mechanism where investors can cast their vote on what the true value of the company is. Buyers buy because they think the stock is worth more and sellers sell because they think the stock is worth less. When buyers and sellers come to some agreement on price, you will find low volatility, sideways trading. When there is uncertainty, prices will change dramatically in a short period of time, often making the risk of the stock greater than the potential reward simply because the market does not have a good understanding of what the company is worth.
![]()
This week, I used the Stockscores Market Scan to look for stocks that have a Sentiment Stockscore of greater than 59 but less than 76 and which traded at least 2500 times on Monday. That turned up a lot of stocks, I checked the charts to see which have them are not already well in to an upward trend. I searched for stocks that have chart patterns that are building toward an upward trend. Here are a few examples:
![]()
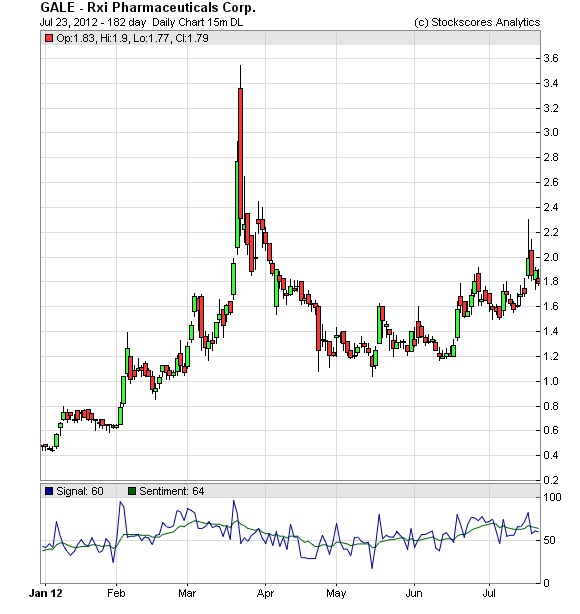
1. GALE
GALE has been building optimism for about a month, I like it on weakness as it pulls back to the upward trend line which it is doing now. Support at $1.55.
2. CLDX
CLDX is building an optimistic pattern under resistance at $5.60, watch for a break through that price level as a cue that the stock wants to go higher. Support at $5.20.

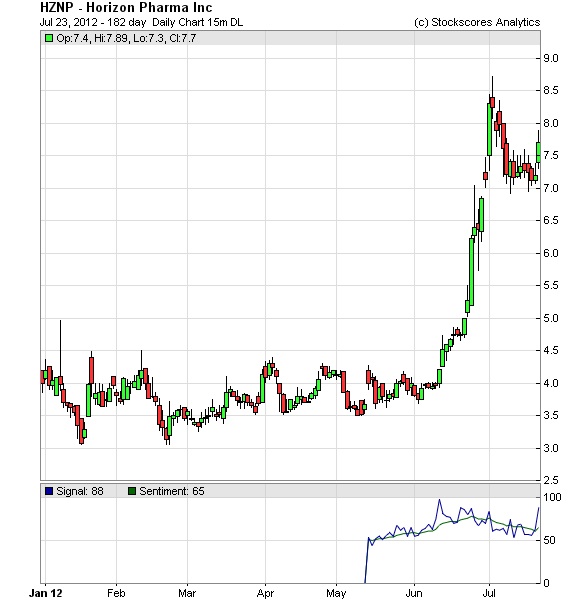
3. HZNP
HZNP has been going up for a while but went in to a pull back flag pattern over the past few weeks. Today, it breaks from that flag and looks like it can continue higher. Support at $7.
References
- Get the Stockscore on any of over 20,000 North American stocks.
- Background on the theories used by Stockscores.
- Strategies that can help you find new opportunities.
- Scan the market using extensive filter criteria.
- Build a portfolio of stocks and view a slide show of their charts.
See which sectors are leading the market, and their components.
Disclaimer
This is not an investment advisory, and should not be used to make investment decisions. Information in Stockscores Perspectives is often opinionated and should be considered for information purposes only. No stock exchange anywhere has approved or disapproved of the information contained herein. There is no express or implied solicitation to buy or sell securities. The writers and editors of Perspectives may have positions in the stocks discussed above and may trade in the stocks mentioned. Don’t consider buying or selling any stock without conducting your own due diligence.


