

Massive VIX Warning for all Traders
01/12/2017 4:18 PMMy analysis of the recent VIX action is clearly warning of a potentially massive price volatility increase in the US and global markets. Many traders use and trade the VIX as a measurement of volatility. The VIX is a measurement of the expected market volatility over the next 30 days. As the VIX rises, traders expect larger and more volatile price swings. As the VIX declines, traders expect smaller and more narrow price swings.
Currently, the VIX is near historical low levels and has recently past a critical cycle midpoint.

One can see from my cycle analysis, I am tracking to cycle events; a longer term top-to-top cycle event and a smaller bottom-to-top cycle event. I call these dual-phase and single-phase cycle events, respectively.
This analysis tells me we recently past a single-phase bottom cycle (near Nov 30th) and are expecting a dual-phase top cycle event near Feb 17th. Given the expected opportunity to retest the VIX high channel, the potential price move in the SSO would relate to a 11%~16.5% price swing (approx) – or larger. The dark blue downward VIX channel is a boundary that we would expect the VIX move to attempt to reach. It could blow past this level and develop a much larger price correction in the US and Global markets but lets just focus on one target at a time for now.
Now, let’s take a look as how this relates on the SSO chart.

The bullish case for gold in 2017
01/12/2017 3:18 PMYou could say gold miners struck gold in 2016. The group, as measured by the NYSE Arca Gold Miners Index, finished the year up an amazing 55 percent, handily beating all other asset classes shown below.
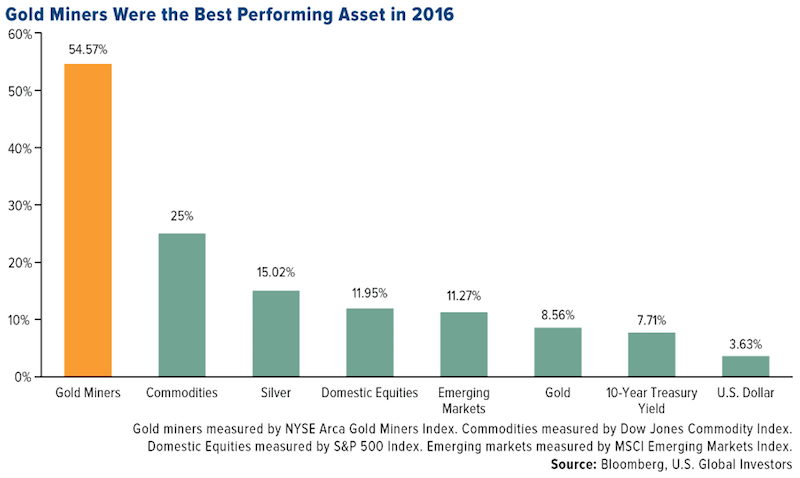
Miners were followed by commodities at 25 percent and silver at 15 percent. Gold finished up 8.6 percent, its first positive year since 2012, when it gained 7.1 percent. (Keep your eyes peeled for our forthcoming annual periodic table of commodity returns, one of our perennially popular pieces!)
I find it curious that many in the financial media continue to have a bias against gold, even though it generated better returns in 2016 than 10-year Treasuries and the U.S. dollar, which performed half as well. And when it was up as much as 28 percent in the summer, they still didn’t have anything positive to say, arguing it had gone up too much.
(Gold traders, on the other hand, have a much different opinion about the metal right now. A group of traders recently surveyed by Bloomberg revealed they are the most bullish on goldsince the end of 2015, soon before it rallied in its best first half of the year since 1974. The traders cited geopolitical concerns, both in the U.S. and Europe, as well as stronger demand in 2017.)
And isn’t it interesting that the same media figures who are biased against gold are usually the same ones who seem to have only disparaging things to say about Brexit and President-elect Donald Trump? What they don’t realize is that if Brexit and Trump succeed, so too do the U.K. and the U.S. Are they hoping Brexit and Trump will fail so they can be proved right?
The smart people realize personal politics must be put aside. Despite supporting Hillary Clinton during the primaries, Warren Buffett now says he is behind the president-elect—because he knows that if the U.S. does well, he does well too. Despite campaigning hard against Trump, President Barack Obama says now we should all be rooting for Trump, regardless of our politics.
Negative Real Rates Should Drive Gold Prices

Stock Trading Alert: S&P 500 Trades Close To Record High – Topping Pattern Or Just Consolidation?
01/12/2017 3:14 PMStock Trading Alert originally sent to subscribers on January 12, 2017, 6:54 AM.
Briefly: In our opinion, speculative short positions are favored (with stop-loss at 2,330, and profit target at 2,150, S&P 500 index).
Our intraday outlook remains bearish, and our short-term outlook is bearish. Our medium-term outlook remains neutral, following S&P 500 index breakout above last year’s all-time high:
Intraday outlook (next 24 hours): bearish
Short-term outlook (next 1-2 weeks): bearish
Medium-term outlook (next 1-3 months): neutral
Long-term outlook (next year): neutral
The main U.S. stock market indexes gained between 0.3% and 0.5% on Wednesday, extending their short-term consolidation, as investors reacted to economic data releases, U.S. President-Elect press conference, among others. All three major stocks market indexes continue to trade along their all-time highs. The S&P 500 index remains relatively close to its Friday’s new record high of 2,282.10, and the Dow Jones Industrial Average trades close to round resistance level of 20,000. The technology Nasdaq Composite has reached new record high on Tuesday. Will the market extend its year-long medium-term uptrend even further before some more meaningful downward correction? The next possible resistance level of the S&P 500 index is at 2,300 mark. On the other hand, the nearest support level is at around 2,260, marked by last week’s consolidation. The next support level is at 2,230-2,240, marked by recent local low. We can see a new long-term high within almost eight-year-long bull market from 2009 multi-year of 666.8. However, the index remains within its month-long consolidation. It continues to trade along its medium-term upward trend line, as we can see on the daily chart:
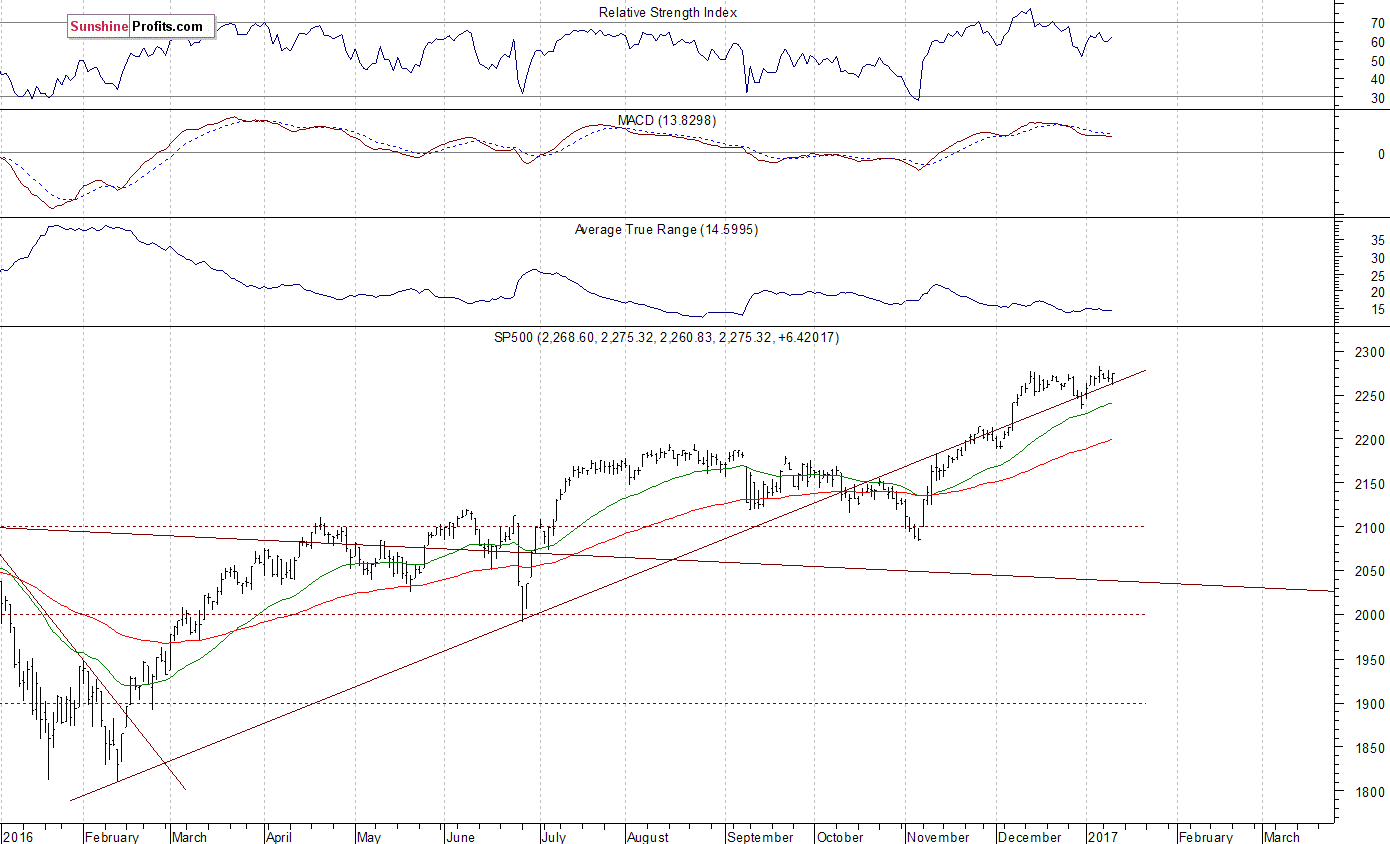
Expectations before the opening of today’s trading session are negative, with index futures currently down 0.2-0.3%, as investors take profits off the table. The European stock market indexes have lost 0.1-0.4% so far. Investors will now wait for the Initial Claims number announcement at 8:30 a.m. The S&P 500 futures contract trades within an intraday consolidation, following an overnight move down. It retraces some of its yesterday’s rally from support level at around 2,255-2,260. For now, it looks like a flat correction within an intraday downtrend. Overall, the market extends its last week’s consolidation along the level of 2,260-2,265. The nearest important level of resistance is at around 2,275, marked by local high. On the other hand, the next support level is at 2,230-2,240, marked by previous local lows. Is this a topping pattern before downward correction of the November – December rally? There have been no confirmed negative signals so far. The futures contract trades along its recent local lows, as the 15-minute chart shows:

A Story Too Good To Be True
01/12/2017 3:06 PMThe European Union's massive bureaucracy on top of individual government bureaucracies has come up with 454 regulations for, wait for it, towels. Wait, it gets better than that.... ...related: More Government Horror: The Impact of Canadian Taxpayers Being On The Hook...

Mid-Week Update: Real Estate & Oil 2017
01/12/2017 2:48 PMThe super-hot Toronto real estate market has much to thank BC and its foreign buyers tax & vacant homeowners taxes. Oil, is there going to be cheating within OPEC and will production pick up and drive prices down? ....also from Michael: Canadian Taxpayers Brace for...

Canadian Taxpayers Brace for another, ahem… “Investment”
01/11/2017 3:45 PMThat's right. No longer is it called a bailout, its now an investment. Canada and Ontario are about to each give Honda 41,800,000 Tax dollars. Despite the fact this money will not only harm taxpayers, the unemployed.... ....related: More Government Horror: The Impact...

Gold’s fate as Western society cracks apart …
01/11/2017 3:24 PM Larry here, with an important message. Right now, gold is still caught in a trading range, but with a long-term bias toward exploding higher over the next few years to at least $5,000 an ounce.
In other words, gold is in the pressure-cooker right now, and once it blasts off, there may be no turning back.
I have another important warning for you: If you think gold’s next major move higher will be due to inflation, think again: Gold’s next leg higher will be primarily caused by Western society tearing itself apart at the seams.
Not because of inflation. Not because of a collapse in the U.S. dollar, which one well-known — but almost always wrong — analyst keeps predicting.
Just consider all the spying that’s going on which has increased, not decreased. If you haven’t already, go see the excellent documentary “Snowden.”
Where you’ll learn of how our government has a dragnet and has intruded into the privacy of not just every American citizen via electronic devices, but every individual in the world via computers and cell phones. And yes, even heads of state.
Or the moves by many developed countries to go to a digital currency. Or the many countries that are now implementing various capital controls.
Or the high-level cyber-espionage now happening.
Or, Obamacare, a disaster of epic proportions.
Then there are the new moves, behind closed doors in Washington, to make depositors in U.S. banks creditors of the bank, meaning if the bank goes under, a certain amount of your deposits is at risk of substantial loss, as if you were a shareholder in the bank.

Most Overvalued Stock Market In U.S. History – Here’s Why
01/11/2017 3:14 PMI find it to be mind-blowing when financial advisors and stock market gurus get in bubblevision or write Seeking Alpha articles and assert that the stock market is good “relative” value right now. They are either dishonest, unethical or just stupid. Likely a...
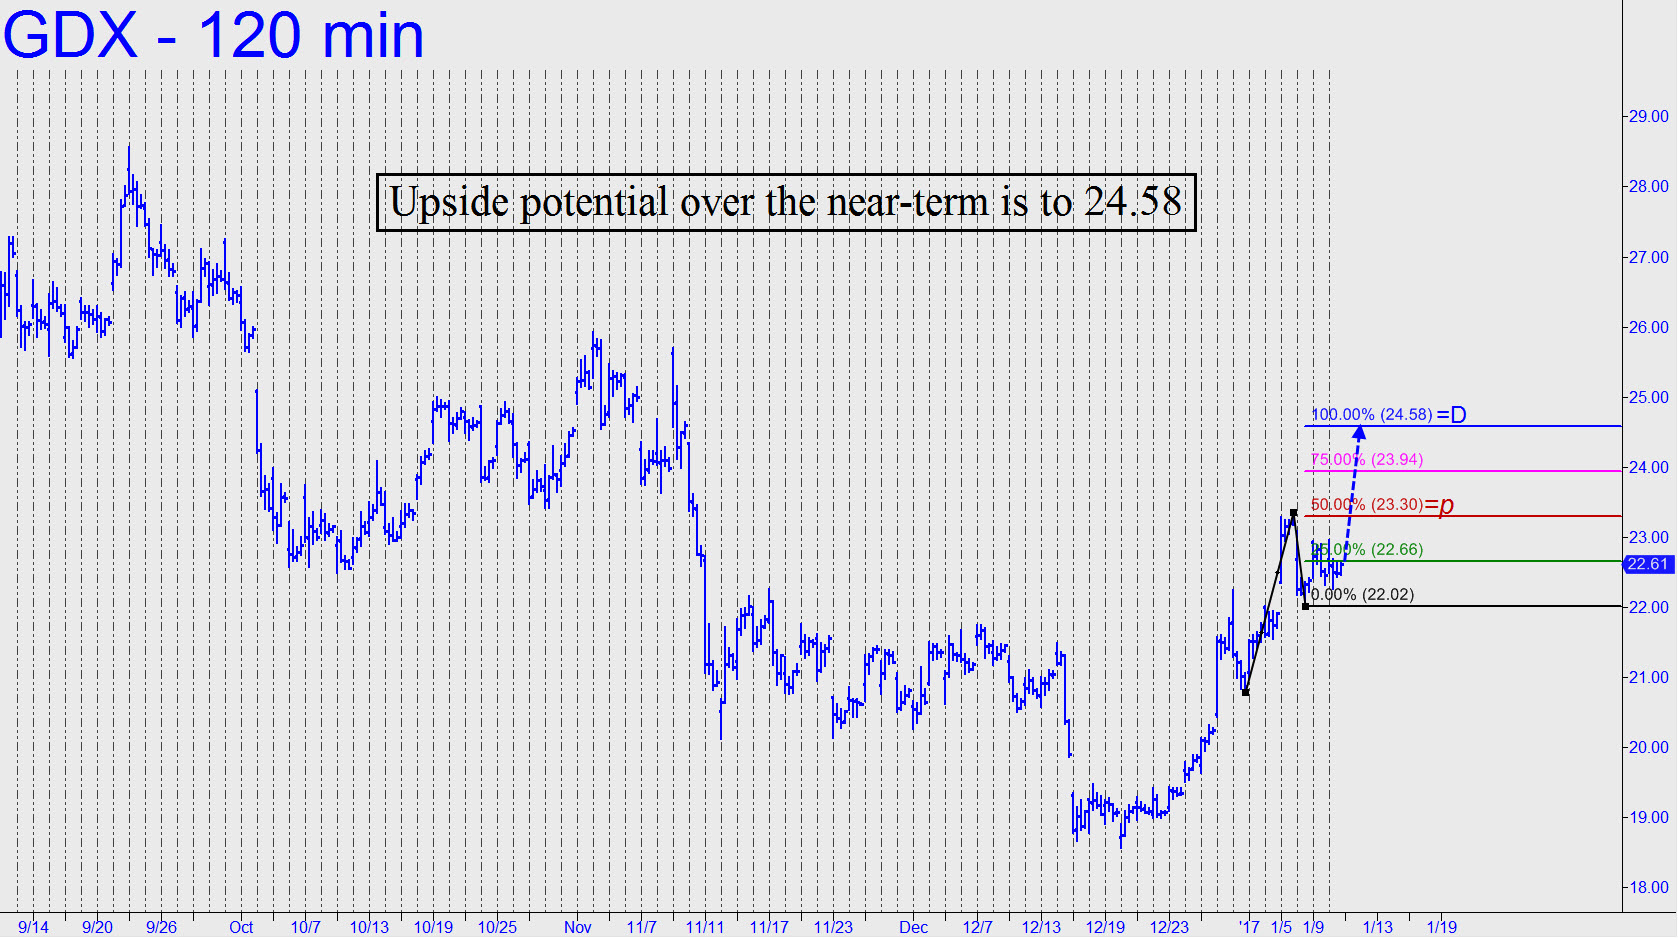
A Bullish Play in GDX
01/11/2017 3:05 PMSubscribers are long 400 shares from 22.61, stop 22.01, based on a real-time guidance for a ‘mechanical’ entry that was posted to chat room Scoreboard at 11:21 a.m. GDX, an ETF proxy for the gold mining sector, is having trouble getting airborne, but if the buying...

Stock Markets: Short Sharp Pullback
01/11/2017 2:56 PMJan 10th 8:45 PM "Despite New Year bullishness from our early January indicators and our expectation for full-month January Barometer gains that will support our modestly bullish 2017 Forecast, a mid-January break in equities is looking increasingly likely. Since 1996...