

In 2006, just as the Housing market was peaking, the NYT ran this graphic of the 100-year Case Shiller chart. It showed how radically overvalued Housing had become.
Two years later, TBP reader Steve Barry updated that graphic, including the projected Home Price mean reversion. (See versions for 2008, 2009 and 2010).
Its time to update this for 2011. Note the 2009 tax credit wiggle:
click image for larger version
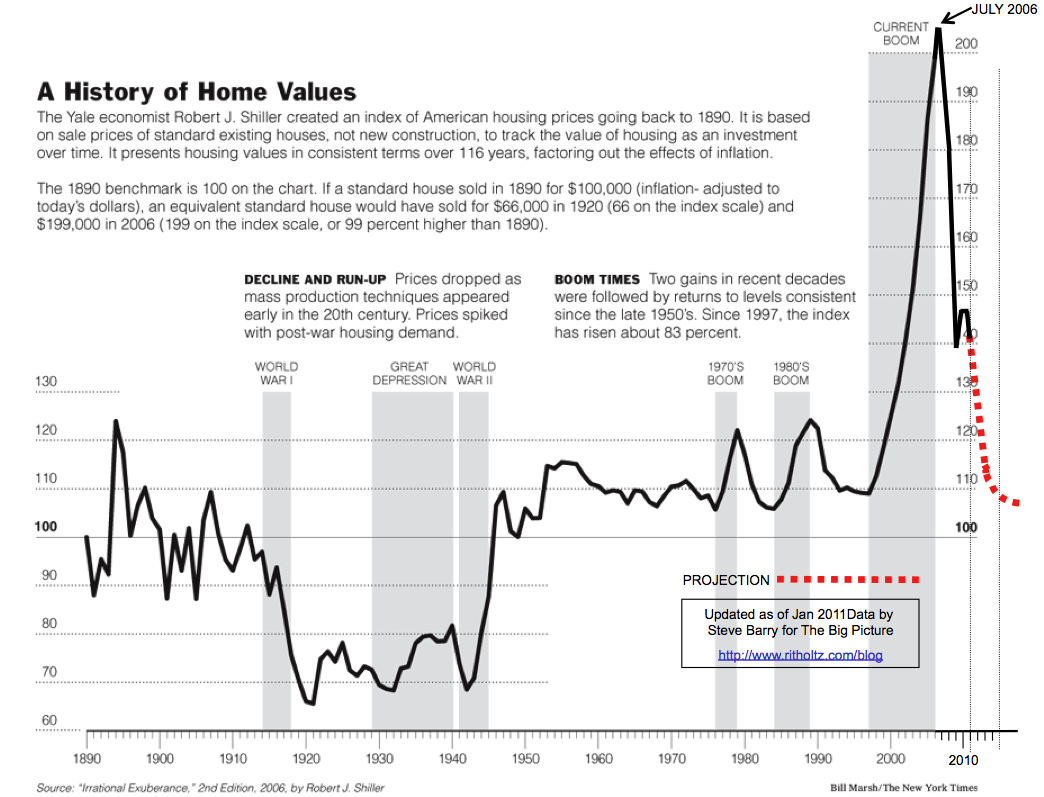
chart created by Steve Barry. Commentary by Barry Ritholtz of The Big Picture
House Prices in Free Fall
The latest house price data (the S&P Case-Shiller index) shows a clear downward trend for the most recent six months, as shown in the graph below:
The next graph shows how this year’s data fits in with the long-term trend. It is clear that the house price bubble, which began in 1997 and peaked in 2006, has not yet finished popping:
How we Got There
The black stars in the above graph highlight 1951 and 1997, the two years when Congress changed how the capital gains tax applies to home sales. The first change produced 46 years of wealth accumulation. The second change produced 9 years of rising house prices and living beyond our means to be followed by about 9 years of belt tightening and economic stagnation.
In 1951, Congress, at the urging of President Truman, instituted the roll-over treatment for taxation of capital gains from home sales, an economically sound treatment of capital gains. As a result, from 1951 through 1997, whenever a homeowner sold his or her primary residence to buy another residence, the capital gains tax was deferred, not forgiven. In technical parlance the gain was rolled-over until the new home was sold. Homeowners would typically build up their equity in one home, sell that home, and then use their savings to make a down payment on a larger home. During that period, there were large changes in interest rates, yet real home prices were quite stable.
In 1997, a foolish Congress, at the urging of a foolish President Bill Clinton, eliminated the capital gain tax on homes sold by most homeowners. This change immediately stimulated the housing price bubble. It told speculators that the capital gain that they would earn would be tax free if they bought a house in the expectation of a rise in its market value and sold it at a higher price. Under the new provision, almost anyone who had lived in a house for 2 years of the past 5 years could sell the house free from capital gains tax. The new policy encouraged people to gamble on real estate. They saw that houses were going up in price year after year. What an easy way to make money!
Here is how Kenneth Harney (2008) described how the 1997 tax treatment encouraged speculation in a Washington Post article about Congress’s 2008 attempt to tighten its provisions:
…..read more HERE (scroll down)