

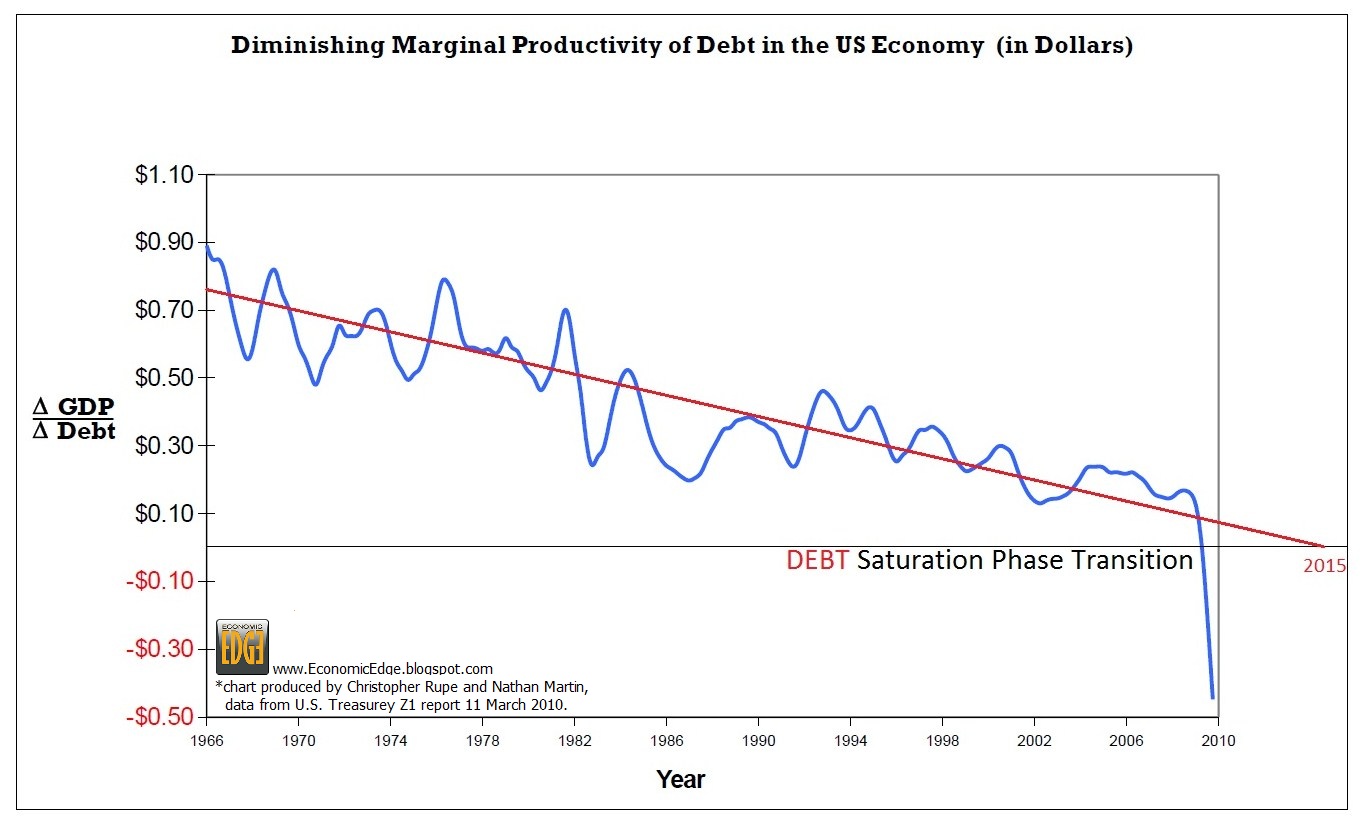
Nathan’s Economic Edge says that this is The Most Important Chart of the Century, I’m not sure I would say it’s the most important chart but it is pretty scary. The chart illustrates how much economic productivity is created by one dollar of additional debt. Back in the early 1960s a dollar of new debt added almost a dollar to the nation’s output of goods and services but by the end of 2009 a new dollar of debt produced a negative 45 cents of economic output. The author calls this situation “debt saturation”. We have a big problem in America, and the end result is going to be a devaluation of the US dollar or potentially a default. – Lou Scatigna (larger chart HERE)
On Major Moves, Peter Grandich has been very right and not only saved many investors fortunes, but expanded them dramatically. On November 3, 2007 at the MoneyTalks Survival Conference, Peter Grandich of the Grandich Letter warned that “an unprecedented economic tsunami will hit American beginning in 2008”. Peter advised publicly to short the US market two days from the top in October, 2007 and stayed short until the last week of October, 2008. He began to buy stocks in March 7th, 2009. He also bought oil and oil related investments near the lows after the dive from $147.
….go to visit Peter’s Website.