

Technical, fundamental and seasonal influences point to less volatility and a positive bias for equity markets between now and at least the end of the year. Preferred strategy is to accumulate economically sensitive equities and Exchange Traded Funds with favourable seasonality at current or lower prices.
Strength of the TSX Composite Index relative to the S&P 500 Index turns positive in the first quarter.

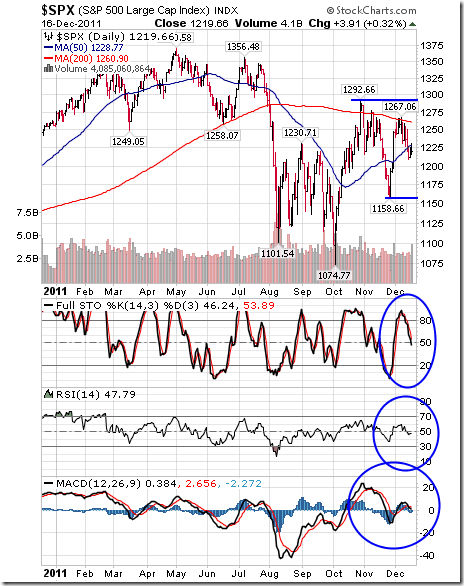
The S&P 500 Index fell 35.53 points (2.83%) last week. Intermediate trend is neutral. Support is at 1,158.66. Resistance is at 1,292.66 and near its 200 day moving average at 1,260.90. The Index fell below its 50 day moving average. Short term momentum indicators have rolled over from overbought levels and are trending down.
The TSX Composite Index dropped 399.37 points (3.32%) last week. Intermediate trend is down. Support is at 10,848.19. Resistance is at 12,542.58. The Index trades below its 200 day moving average and fell below its 50 day moving average last week. Short term momentum indicators have rolled over and are trending down. Stochastics already are oversold, but have yet to show signs of bottoming. Strength relative to the S&P 500 Index remains negative.

The U.S. Dollar gained 1.63 last week. An intermediate uptrend was confirmed on a break above resistance at 79.84. The Dollar continues to trade well above its 50 and 200 day moving averages. Short term momentum indicators are overbought, but have yet to show signs of peaking.

Crude oil dropped $6.03 per barrel (6.04%) last week. Intermediate trend turned negative on a break below support at $94.99. Crude also broke below its 50 and 200 day moving averages. Short term momentum indicators are oversold, but have yet to show signs of bottoming.

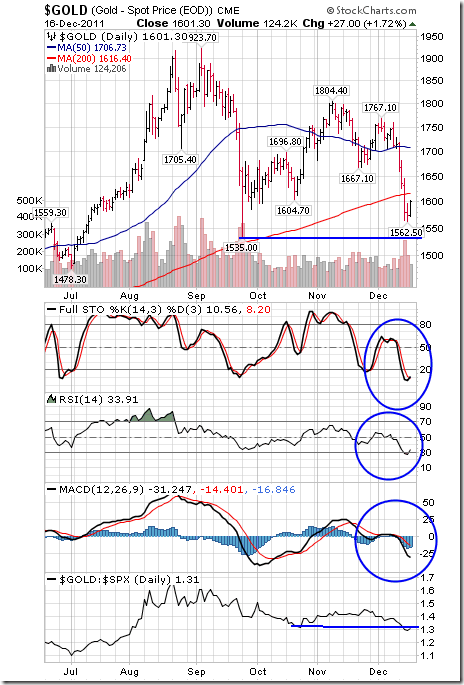
Gold plunged $112.70 U.S. per ounce last week. It broke support at $1,667.10, its 50 day moving average at 1,706.73 and its 200 day moving average at 1.616.40. Next support is at $1,535.00. Short term momentum indicators are oversold, but have yet to show significant signs of bottoming. Strength relative to the S&P 500 Index has turned negative.
….go HERE for much more commentary and 40 more charts.