

We analyze the latest technicals for gold and silver.
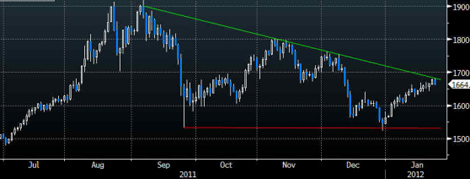
On the technical front, like last week, gold is still bumping up against a significant downward trendline that connects the September record high with the November rebound high. That resistance currently lines up around $1675/oz.
A breakout to the upside would be a strong indication that gold’s bull run has resumed.
This past week was another positive one for precious metals. Silver surged, while gold edged slightly higher. News-related catalysts for the sector have been nil. Instead, prices seem to be taking their cues from movements in broader financial markets. The daily correlation between gold and the S&P 500 Stock Index over the past two-week and one-month periods has been more than 0.90.
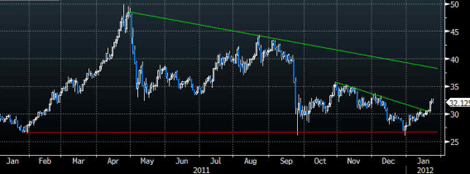
Meanwhile, silver outperformed this past week. The white metal broke above the first of its downward trend lines and now looks poised to move toward $35. From a technical perspective, silver remains in a downtrend until it can break above a much more significant trend line above $35.
…read pages 2 thru page 7 HERE