Seasonality refers to particular time frames when stocks/sectors/indices are subjected to and influenced by recurring tendencies that produce patterns that are apparent in the investment valuation.
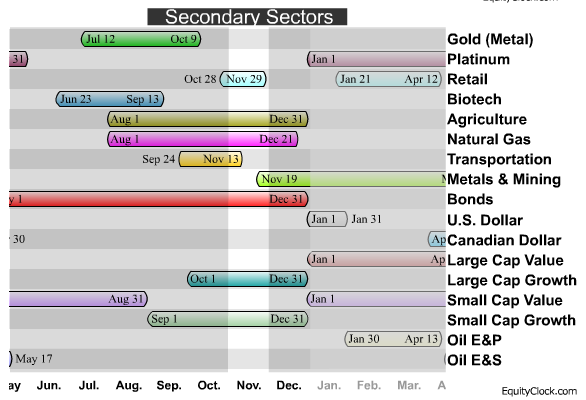
Identified below are the periods of seasonal strength for each market segment. Each bar will indicate a buy and sell date based upon the optimal holding period for each market sector/index.
A seasonality study preferably uses at least 10 years of data. Most of our studies use 10-20 years of data, however, data may not always be available for periods greater than 10 years in length. Studies using less than ten years of data can be used, but they tend to be less reliable. Results of shorter term studies have a higher chance of being skewed by a single data point.

Tendencies can range from weather events (temperature in winter vs. summer, probability of inclement conditions, etc.) to calendar events (quarterly reporting expectations, announcements, etc.). The key is that the tendency is recurring and provides a sustainable probability of performing in a manner consistent to previous results.
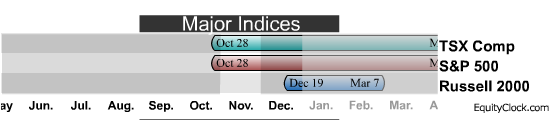
The periods of seasonal strength for each market segment, as they are identified by Brooke Thackray. Very detailed article on Seasonal Investing by Brooke Thackray HERE
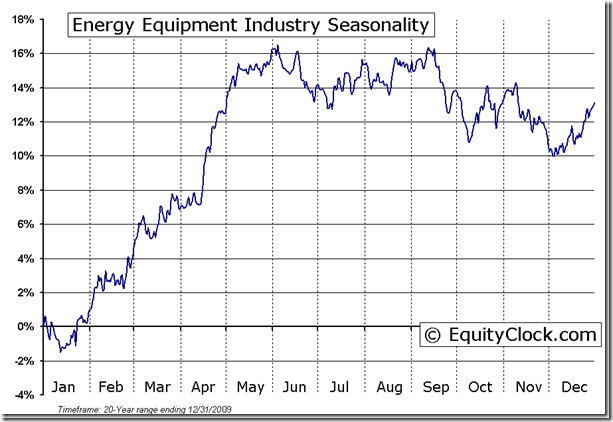
Ed Note: Lots more at EquityClock.com including charts of small portions of individual stock sectors in energy. For example, the following Energy Equipment Industry Seasonality indicates its about to go on a sharp run to the upside beginning soon. If you are going to be in the stock market……