

It didn’t matter which market we were watching – currencies, commodities, stocks – they had become oversold after a plunge throughout the month of September 2011. We expected a bounce and positioned our members accordingly. It is paying off so far. And as we currently see it, this is only a near-term correction that is going to be resolved in another major market collapse.
Perhaps the magnitude of the September move won’t be matched in depth and/or speed, but we believe most markets will ultimately fall through those September lows.
As those who follow us regularly know, we are big fans of using Elliott Wave principles to pinpoint trade setups. We recently came across this article from Elliott Wave International that does a good job of establishing the technical justification for another steep market decline. Give it a read – you’ll learn a lot in just 5 minutes.
Thanks,
Jack
P.S. They are also offering a FREE report at the end of the article. I think it’s worth checking out — you’ll be happy you did …
Did the Past 7 Weeks of Rally Lull You to Sleep?Here’s why you SHOULDN’T get too comfortable
Don’t get me wrong — we are not in the bear market territory yet. At least, not officially. An “official” bear market begins when the stocks indexes decline 20%. The DJIA’s decline from the May 2, 2011 high to the September 21 low is about 17%. Close, but no cigar.
Add to that the strong rallies we’ve seen over the past few weeks (Sept. 12-20: +685 points in the Dow, for example) — and lots of people conclude that despite the volatility, things aren’t so bad.
But let’s get some perspective. The stock market has been around a while. Only when you look at its history do you realize just how cunning — and fast, and strong — bear markets can be.
Here’s a chart we’ve shown readers before. It’s worth printing out and keeping on the wall above the desk where you open your brokerage statements.
This is the DJIA between 1930 and 1932, one of the worst bear markets in history. Robert Prechter, EWI’s president, took the time to measure the percentage gain of each bear market rally during the 2-year period — you can see them in this chart.
When you routinely see double-digit rallies (11 percent, 18 percent, even 39%) over the course of two or three years, it’s easy to be lulled into thinking that maybe things aren’t so bad.
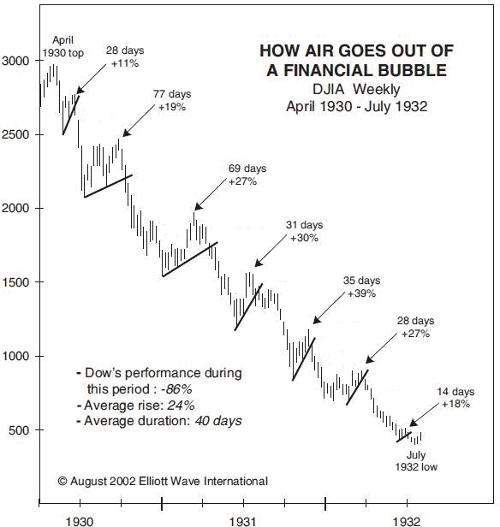
The reality, of course, is that the bear market’s chokehold grows tighter around your neck with every drop-rally sequence. (Think back to the 2007-2009 collapse, and you’ll remember the same behavior.)
Which brings us to here and now. Rallies and declines of 300-400+ points have been so common since August that we’re kinda getting used to them.
The question is: Are we in a bear market, or is it that “maybe things aren’t so bad”?
You need some perspective to answer that question. The research we do here at EWI can help.
(Ed Note: I have subscribed and downloaded and took a screen shot of the 3 shocking charts below.)
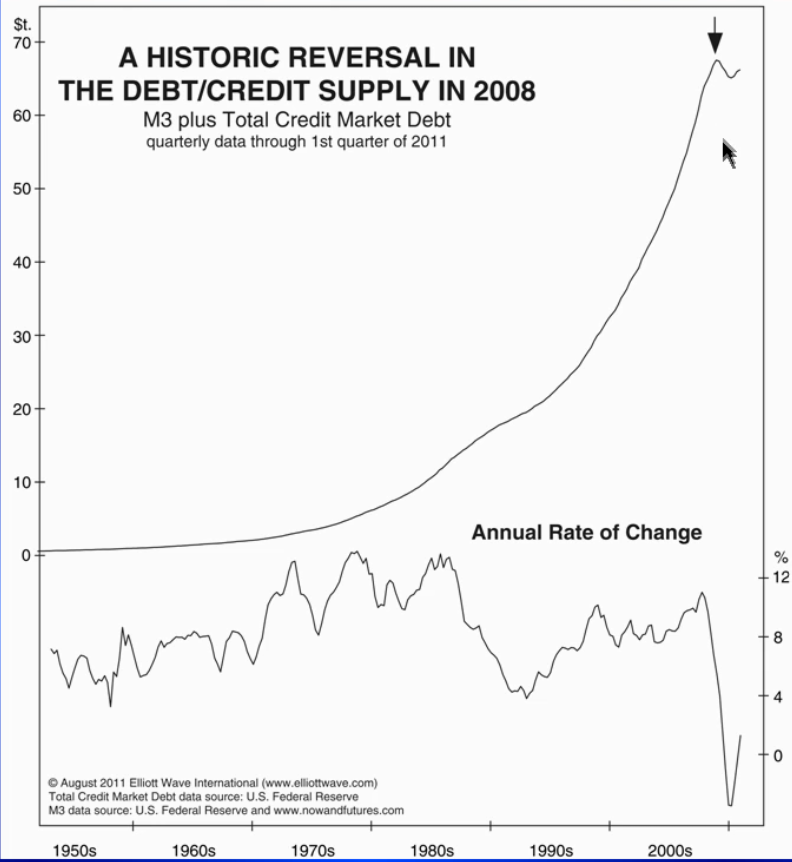
What is the problem behind the markets? According to Bob Prechter the answer is Debt began to implode in 2008. As you can see on this first chart below, “debt has been growing constantly since the 1930’s, it got into a parabolic rise in the 1990’s and 2000’s That’s what supported the Real Estate market and the stock boom, all these new dollars in terms of IOU’s. That change reversed in 2008, had a slight recovery during bear market rally from 08′. But this trend is exhausted”. – Prechter
Prechter thinks “we started a new Bear Market when all the markets hit an all-time high, real estate in 2006, Stocks in 2007 and commodities in 2008, and that the Historic Reversal in the Debt/Credit Supply is about a Deflationary Depression which is already upon us”. – Prechter
What is the major component of the Debit/Credit line above? Mortgages . You can see in the chart below that Mortages actually peaked in 2005, a year before the Real Estate market peaked in the USA. You can also see below that the number of mortgages fell to a new low last year in 2010 when an Economic recovery was supposed to be in motion.

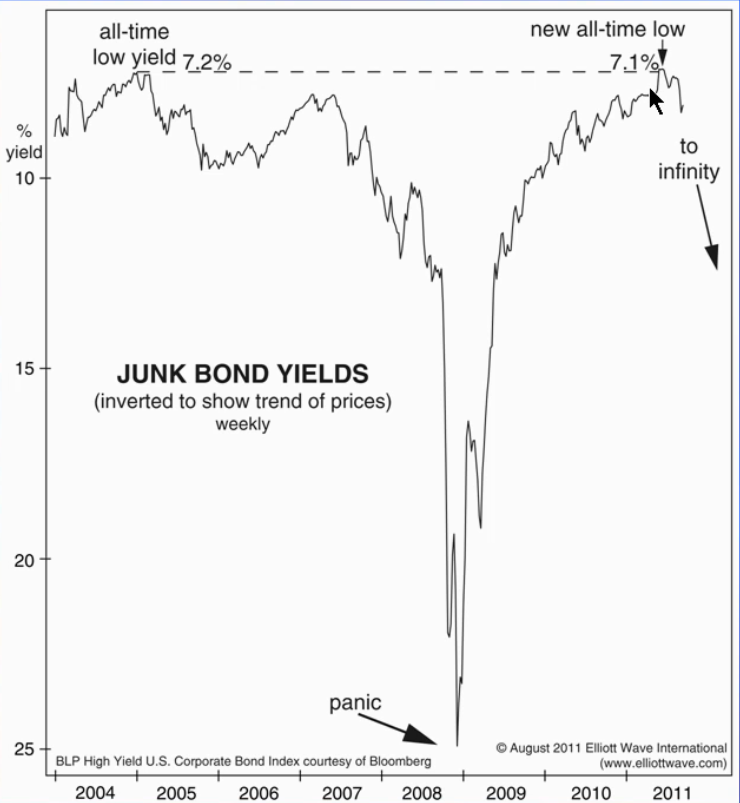
Elliottwave’s Bob Prechter thinks that complacency at an all time low as measured by Junk Bonds precedes an imminent collapse. Junk bonds actually made a new all time high price in April of 2011, taking out the Optimism of the high’s in 2005. A new decline has begun and if it takes out the bottoms struck in 2008 “they are going to go to zero” – Prechter
EWI report Buying Opportunity Ahead or Another “Free Fall” Ahead that Jack Crooks refers to, you can subscribe to the EWI Free Report HERE