

Click on the Chart or HERE for larger image:
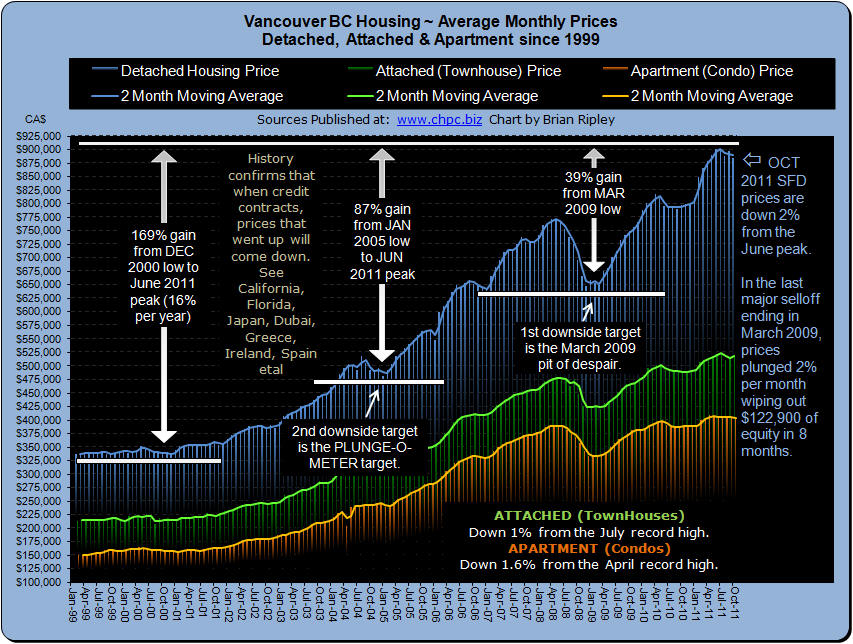
This chart shows Vancouver detached, attached (townhouse) and apartment (condo) prices. In October 2011, detached house prices fell 1.3% M/M even as inventory dropped over 25% for the month. SFDs are now 2% and nearly $17,000 below their peak set 4 months ago in June.
Condos are trading in price of only 3% above what they were 3.5 years ago in May 2008. It took 7 years to run the average SFD prices up from the flat price channel of 2001 to the first peak in April 2008. Then an 8 month 16% decline and a loss of $123,000 in equity led to a relief rally beginning in January 2009 which zoomed for 16 months but then blew out in April 2010. The April 2010 high was replaced with the new June 2011 spike high fueled by low cost high risk leverage designed by the Federal government insured by the taxpayer. Vancouver is the most unaffordable place to own real estate out of 325 international cites according to Demographia. The average earnings in BC are falling and are 3.6% below Canada’s national average (Earnings Chart) and have been trailing the national trend for 22 months.

Click on the Chart or HERE for larger image:
This chart shows the detached housing prices for Vancouver, Calgary, Edmonton, Toronto, Ottawa* and Montréal. In October 2011 western Canadian cities slumped in price and sales in Alberta dropped down double digits M/M. (Scorecard). In central Canada prices rallied especially in Toronto but remain below their peak set 4 and 5 months ago (Plunge-O-Meter). Global attention is now looking at risk in the credit markets as Europe wakes up after binging on debt to find that the promise of repayment can easily turn to default. Canadian credit markets are assessing risk; the 5 year fixed mortgage rate ticked up 10 beeps, so now is a good time to look at real estate as an investment rather than a speculation; figure it out yourself here. (*Ottawa are combined residential)