
The Bottom Line
Technical, fundamental and seasonal influences point to another volatile week in equity markets around the world, but with less intensity than recorded last week. Markets have started to recover from a deeply oversold level. Most likely scenario is for equity markets and most sectors to move higher during the next 2-3 weeks followed by a test of lows as part of a base building period during seasonally weak September followed by resumption of an intermediate uptrend by the end of October. Preferred strategy is to hold/add to sectors that benefit from favourable seasonal influences at this time of year (e.g. gold equities, agriculture, “gassy” equities) and to watch for entry points on weakness in other economically sensitive sectors in October.
Interest Rates
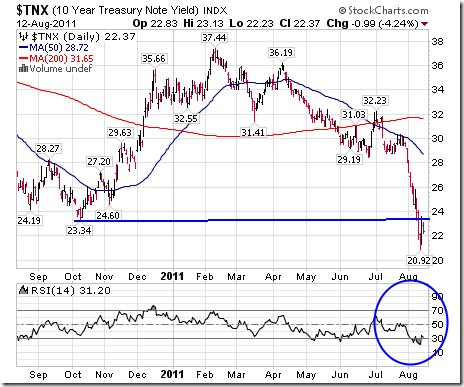
Ironically, the reduction in the credit rating of Treasuries pushed Treasury yields down. Ten year Treasuries fell another 32 basis points last week and broke long term support at 2.33% The yield on two year Treasuries reached an all time low on news that the Federal Reserve intends to maintain low rates on Treasuries until mid 2013. Momentum indicators show that yield now is deeply oversold and showing early signs of bottoming.

Gold gained another $84.50 U.S. per ounce (5.08%) last week. Its all time inter-day high was reached on Thursday at $1,817.60 U.S. per ounce. Intermediate trend remains up. However, gold came under pressure on Thursday and Friday after the Chicago Mercantile Exchange raised margin requirements on gold futures by 22%. Amazingly, the retreat in gold prices was modest. Momentum indicators are substantially overbought, but have yet to show significant signs of peaking. Gold equities recorded significant strength relative to gold late last week. Gold stocks were prominent on the list of stocks breaking resistance last week. Mark Leibovit, a long term gold bull recommended taking trading profits on gold bullion on Friday. He remains long term bullish.
Silver gained $0.74 per ounce (1.93%) last week. It currently is testing its 50 day moving average where support is possible. Strength relative to gold was notably weaker last week. Short term momentum indicators are moving down from oversold levels. Stochastics already are oversold.

The TSX Composite Index gained 380.03 points (3.12%) last week. Intermediate trend is down. The Index remains below its 50 and 200 day moving average. Short term momentum indicators are recovering from deeply oversold levels. Strength relative to the S&P 500 Index has turned sharply positive. Upside potential is to at least its break down level at 12,763. 54.

Crude oil slipped $1.40 per barrel last week (including a $9.59 per barrel recovery from lows reached on Monday). Its 50 day moving average fell below its 200 day moving average on Friday (Death Cross?). Short term momentum indicators are recovering from deeply oversold levels. Crude easily could recover to its break down level at $89.61.

… be sure to check out the other 48 Charts including Seasonal Charts and articles Don posted this morning August 15th HERE